Yes they are interesting in their differences from mine. My power values are negative so is that because either the current or voltage is negative? You seem to be using my circuit so why is the supply power plot the inverse of mine, but the capacitor one is fairly similar? Hmmmmm
Power values that are true negative indicate power being delivered. True positive power means power absorbed.
The reason for this is because power being delivered is not necessarily being lost as heat. Power coming out of a battery does not immediately mean it is being lost to heat. It's only some resistance that would absorb the power and dissipate it as heat.
Also note that you can't really define an efficiency that is only over part of the operation of the product unless only that part will always take the same form for all applications of that product. That's because depending on the operating mode the efficiency may vary and as it moves from one mode to the next (even smoothly) you have to get an averaged value not an instantaneous value, and it has to be over the range in which it will be used.
What this turns out to mean is that if you operate over 1 second you may get a different efficiency than if you operate over 100 seconds. Efficiencies of converter circuits are made over rather large time scales so that the circuit reaches some sort of equilibrium. A charging capacitor is not yet at that point unless it will always be used exactly like that.
The sim efficiency is quite close to that measured and the original circuit layout I gave is the basis of the whole circuit, so there aren't other parts that are being ignored. I agree that over 100s the value may be different than over 1s, just as I have shown in post 138 a difference with different PRFs. But so long as I am consistent in the measurement time, bench and sim, then they have value for my purposes.
Hi,
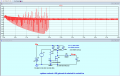
These two plots show the effect on the 'bleed' when the Simulation parameters are slightly modified,
I suspect the 'drips' are artefacts of the simulator.
E
Thanks, good to hear, so can you elaborate on the changes you made, or if complicated, send over the .asc file? Or was it just the addition of the .options statement?
At 100Hz the efficiency rises (see pic) and at 500Hz it's risen by only a further 0.2%. It's interesting that the model is able to simulate all (most?) of the processes that will affect the way energy is transferred to the capacitor.
The sim efficiency is quite close to that measured and the original circuit layout I gave is the basis of the whole circuit, so there aren't other parts that are being ignored. I agree that over 100s the value may be different than over 1s, just as I have shown in post 138 a difference with different PRFs. But so long as I am consistent in the measurement time, bench and sim, then they have value for my purposes.
There is another useful insight that this sim circuit can offer and that is the resonant frequency of what is effectively (I assume) an LCR circuit despite the pulsed input.
If I gradually ramp up the pulse frequency of V2, or better still, calculate a typical resonant frequency and then sweep values around that, what would I see in the Spice outputs and where best to probe parts of the circuit to demonstrate a resonance?
Since it’s a while back I attach again the sim circuit.
JulesP,
You are doing a very simplified simulation. You do not take into account the parasitic capacitance of the winding, and it can be significant - at the level of nanofarads. You also don't take into account the skin effect. The simplest way to account for the skin effect is to add a parallel resistor to the inductors.
In this case I’m not trying to mimic my bench circuit. I’m only looking at the sim circuit by itself and wondering how one would show it in resonance in terms of measurement points and calculations. Equal reactance of both L and C? If so how best to measure that. There will presumably be a sim pulse frequency that will radically change the circuit’s responses.
What makes you think that the optimum coincides with the resonance? It can be without resonance. And with your inductances and capacitances, the oscillating circuit has a frequency of about 0.01 Hz. (318.e-3/3.*53.e-3)^0.5/2./pi = 0.01192919118908
@JulesP
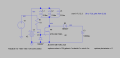
In circuit below:
Capacitor C1 is charging from constant current module I1 with efficiency 96%. Сonstant current module price is $0.99, free delivery on AliExpress.
But efficiency of charging battery Lead_bat from capacitor C1 theoretically can not be more than 50%.
In this circuit overall (from I1 to Lead_bat) efficiency is 44%. __
 Facebook
 Google
 GitHub
 Linkedin