Facebook
 Google
 GitHub
 Linkedin
I would like to be able to plot waveforms of capacitor transient currents and voltages in both charging and discharging phases.
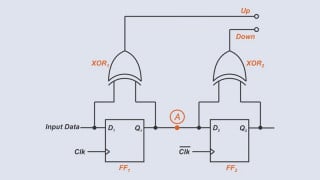
This would be steady state, but what the heck is the circled anomaly?

But how do I designate the actual charging and discharging based on the calculated time period? Or do I even need to have the time period for LTS to do this?
This would be steady state, but what the heck is the circled anomaly?
But how do I designate the actual charging and discharging based on the calculated time period? Or do I even need to have the time period for LTS to do this?


")