Spreadsheet for Common Emitter Amplifier Design (BJT) - Look what I did!

Thread Starter

kiroma

Joined Apr 30, 2014
120
Hello everyone!
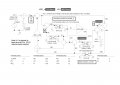
I spent months doing this spreadsheet, trying to make something that has its worth in the help of designing a BJT CE amplifier stage. Really simple, resistive base divider, resistor on the emitter to linearize, collector resistor for simplicity... But the transistor model is quite accurate, it's the same effect as Falstad circuit simulator, and the hard part was to make it work with Early effect. It shows the load line, the point you chose for the transistor saturation, the point you chose for the cut-off, the quiescent point, and the maximum and minimum points that the amplifier gets to when the input has that much peak voltage.
I recommend to read the "How to use" sheet to know some quirks of the way I did the calculations.
To reinforce, it's not guaranteed the convergence as in a simulator because it's a spreadsheet. I know I could use Excel with Python to use a script and spreadsheet at the same time. Maybe someday I'll do it. For now it agrees with simulations, so I think there could only be minimal errors.
Link to the spreadsheet - sorry for using an unknown software, but I went for it because google sheets would get me bored, the visual of Zoho is better for me. It just doesn't have the feature of circular references (iterations).
I'm looking for suggestions in how to improve it, but doubts in how to use are welcomed too, because maybe it's not clear how to use it, and probably I'll have to update the how to use part.
Let me know what you guys think of it.
 

Jerry-Hat-Trick

Joined Aug 31, 2022
836
I applaud anyone who uses spreadsheets to solve problems. Recently I wrote a VBA macro to do FFT on a square wave and sine wave to check my algorithm was right before writing code for a processor. Maybe “Mathcad” is better but spreadsheets are so quick and easy
 

Thread Starter

kiroma

Joined Apr 30, 2014
120
I applaud anyone who uses spreadsheets to solve problems. Recently I wrote a VBA macro to do FFT on a square wave and sine wave to check my algorithm was right before writing code for a processor. Maybe “Mathcad” is better but spreadsheets are so quick and easy
Thank you, I also think the same way, Mathcad is more useful, in my view (the little I used many years ago), if you deal more with equations than numbers. Spreadsheets are wonderful for quick changes of inputs to analyze the behavior. I also did FFT few years ago at my job when I needed, but it wasn't with VBA.
 

LvW

Joined Jun 13, 2013
2,035
.....for quick changes of inputs to analyze the behavior.
In this context, perhaps also interesting:
Based on the known equations for transistor amplifiers (Shockley equation), I created a large-signal SPICE-based model consisting of a block diagram (summing junctions, multipliers, amplifiers, transfer functions) as is known from control engineering.
This allows both the classic transistor characteristics and the amplification properties to be demonstrated.
The various SPICE-analyses are possible: DC, AC, TRAN.
All parameters (B, Early voltage, DC operating point, load impedance, etc.) can be varied as desired.
Unlike the classic SPICE model, the block diagram illustrates how the bipolar transistor works as an amplifier or as a switch.
This model is, therefore, primarily intended for educational purposes
 

Thread Starter

kiroma

Joined Apr 30, 2014
120
In this context, perhaps also interesting:
Based on the known equations for transistor amplifiers (Shockley equation), I created a large-signal SPICE-based model consisting of a block diagram (summing junctions, multipliers, amplifiers, transfer functions) as is known from control engineering.
This allows both the classic transistor characteristics and the amplification properties to be demonstrated.
The various SPICE-analyses are possible: DC, AC, TRAN.
All parameters (B, Early voltage, DC operating point, load impedance, etc.) can be varied as desired.
Unlike the classic SPICE model, the block diagram illustrates how the bipolar transistor works as an amplifier or as a switch.
This model is, therefore, primarily intended for educational purposes
Where I can access this SPICE-based model?
 

Thread Starter

kiroma

Joined Apr 30, 2014
120
You need no specific access - if you are interested, I can post a picture of the block diagram in this forum (due to time shortage only tomorrow).
I'm really interested, would be so nice to see similar efforts of what I did.
 

LvW

Joined Jun 13, 2013
2,035
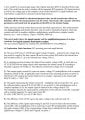
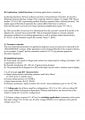
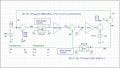
Here comes the block diagram (npn transistor, common emitter gain stage, see the enclosed jpg-files (diagram and description).
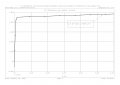
As an example, I have enclosed a jpg-file showing the Ic=f(Vce) characteristic for Vbe=const.

Schematics.jpg
 

Attachments

Last edited:

LvW

Joined Jun 13, 2013
2,035
I am impressed! This is certainly a much more in-depth modeling effort than I have seen or used. Thanks for sharing it. with us.
Thank you.
I like to mention that I am very interested in some comments to the shown block diagram (errors, improvements, restrictions,...)
 

MisterBill2

Joined Jan 23, 2018
27,897
That diagram in post #8 is quite complex, and it may not match the amplifiers that I have created, at least in all of the terminology.

Probably my amplifier choices are much more application based, with the majority being either instrumentation amps from strain gage inputs or audio amps with either microphone or transducer inputs and speaker or line level outputs.
 

Thread Starter

kiroma

Joined Apr 30, 2014
120
Hello again, I have great news to update who's interested in this spreadsheet.
I've been using Claude Opus 4.8 (I didn't want to update to 5.0 because it seems it outputs more, so more tokens spent) to verify things, suggest new ideas, suggest improvements... I've personally revised everything I could to adjust for AI slop. And what I got is this.

Summary of work from the Claude Opus:

The workbook was refactored to make every key cell self-documenting: ~138 defined names were created that map raw cell addresses to the physical quantity they hold — e.g. Principal!$B$3 → Vcc, $B$26 → Ic_total_q, $B$6 → V_Rc_q, $E$29 → Vb_min_target, and so on. Formulas were rewritten to reference these names instead of $B$3-style addresses, so the sheet reads like the circuit equations (Vce = Vcc - V_Rc_q - (Itot + Ib)*Re) rather than opaque coordinates.

New convergence engine (V1.2.0). The previous engine — a hand-unrolled damped fixed-point iteration (~1100 cells, a manual initial guess guess_* and a hand-tuned relaxation factor relax_* per point) — worked and was verified; it was simply slow and inconvenient to use. It relaxes the Early-effect current with (for example, the worst case scenario) relax = 0.02, which needs ~200+ cycles to fully settle, while each block only had ~19 cycles — so it stopped ~25 % short of its own settled value (e.g. it read Ic ≈ 394 µA while the same scheme, run to completion, settles at ≈ 314 µA).

It was replaced with Newton–Raphson in a compact, auditable table, one LET cell per step:
- 8 Newton steps per point, self-seeded (Ic₀ from design/linear estimate) — the guess_* and relax_* inputs are gone.
- Automatic regime handling (cutoff / active / saturation) with a physical clamp, replacing the old overflow guards.
- Converged outputs written to the same cell addresses the Principal sheet already read → Principal and all charts untouched.
- No VBA (native formulas, recalculates live).
- Added a visible relative residual per point (Q = 0, MIN = 0, MAX = "saturation (clamp)").
- Verified: matches an independent Python model, zero error cells in the workbook, and it re-converges automatically when inputs change (tested Vcc = 12 → 24 → 6 V, residual stays 0) — the "any operating point" robustness you asked for.

Fixes: dropped the now-dead "Didn't converge" guard; gm, r'e, rπ now use n·Vt (correct when ideality factor ≠ 1); guarded a #DIV/0 at cutoff (Ro_dc when IRo → 0).

New "Additional analysis" section: gain in dB (no-load and overall) plus a phase note (CE inverting, −180°); total supply current, DC power drawn and class-A efficiency η; high-frequency response — two datasheet inputs (Cob/Cµ, fT) → Cπ, Miller input capacitance, and the dominant upper −3 dB frequency; bias stability factor S; nearest E24 commercial values for Rc, Re, the divider resistors and the coupling caps.

Load-line chart: added a clean straight DC load line (because I switched to Excel) (slope −1/(Rc+Re)) and an AC line through Q; operating points became separate labelled markers; conventional orientation (Vce on X, Ic in mA on Y), axis titles, fixed ranges, major+minor gridlines, PlotVisibleOnly disabled so hidden helper data still plots.

Layout: input cells highlighted yellow with a legend; status cells on conditional formatting (green ok / red problem); styled section headers; frozen top rows; "How to use" expanded with items 11–16.

1.2.1 (2026-08-02) — newest

- An AC load line was added, one that includes the loading effect. It doesn't coincide with the DC line (Rc + Re ≈ 10.9 kΩ) because Rload is AC-coupled through Cout — they'd merge only with no load. The chart series is named "Load line with load (through Q)". Note 14 in "How to use" updated accordingly.

See attached files. One is in English and other is in Portuguese.
 

Attachments

LvW

Joined Jun 13, 2013
2,035
That diagram in post #8 is quite complex, and it may not match the amplifiers that I have created, at least in all of the terminology.
I think, the diagram in post#8 looks more complex than it really is.
One shoud realize that it contains the mathematical description of the BJT and the surrounding parts (R and C) for simulating a complete gain stage.
The following simplified version of this diagram is a mathematical model which describes the main functions of the BJT only.
Note that it does not contain the base current IB which is not important for the basic working principle because of Ic=f(Vbe).

This basic model can be used for simulating the the two main functions (set RC=0)
* Output characteristics Ic=f(Vce) for Vbe=const.
* Control characteristics Ic=f(Vbe) for Vce=const.

* More tan that, a simulation of the switching characteristics Vce=f(Vbe) is possible (set RC to some kOhms).

BJT_only.jpg
 
Last edited:

LvW

Joined Jun 13, 2013
2,035
I think you meant "than it really is".
The rest is very good to me, although it should be noted that it it's only for DC analysis.
Thank you for your comment (I have corrected the typing error).
Regarding the analyses: Yes - it is the only purpose of this simplified version to show the principle I have used to create the model. Hence, only DC analyses are possible.
For AC analyses (gain with/without feedback and with/without an external load) one must use the model as given in post#8.
 
Top