Facebook
 Google
 GitHub
 Linkedin
Hello,
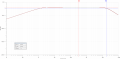
I have a problem which I can't find the solution. It's related with the determination of the bodeplot of a circuit. According to my bodeplot in the simulation, the flat part of the magnitude plot is -23.02 dB (Simulation.PNG) and the cut-off frequency is equal to 17.67 MHz whereas the flat part of the magnitude plot from the vector network analyzer (Help_VNA) is around -7 dB and the cut-off frequency is around 20 MHz.
Moreover, the frequency characteristic seems the same as given in the simulation, but the magnitude is different. Does anyone know why there is a difference?
Network analyzer:
flat part at -7 dB and cut-off frequency at -10 dB
Simulation:
flat part at -20.02 dB and cut-off frequency at -23 dB
I am using an Agilent 4395A network- spectrum and impedance analyzer with Agilent 87512A which is attached to input A and R.
Attachments
-
 3.3 MB Views: 8
 -
 457.9 KB Views: 8