Facebook
 Google
 GitHub
 Linkedin

I am having trouble performing a task using Cadence; let me explain what I have managed to do so far: I successfully determined the rise and fall delay times and set up a skew system using the variable VAR("Delay_B"). The reason for this is that the instructions require the following:
Consider the skew at each 5.0 ps point. The skew varies between -200 ps and +200 ps, with time zero at tskew = 0. Display the waveforms for tpDH and tpLH (maximum and minimum values must be legible) to show how the times were obtained. Indicate how the requested times were measured (use small steps for the simulation, e.g., 5ps). Plot the analyzed time versus skew (vertical axis showing tpDH and tpLH values, and horizontal axis showing tskew).
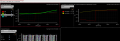
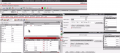
I managed to generate the rise and fall delay times and the skew, as well as the calculation involving the formula (TpLH/TpHL)*Skew (keeping in mind my variable VAR("Delay_B")). When that didn't work, I tried a "Wave vs. Wave" approach, but that didn't work either—resulting in the waveforms shown here.
I’d like to know if I did anything wrong, and also if there’s an easier way—something automatic—to get this function working
Consider the skew at each 5.0 ps point. The skew varies between -200 ps and +200 ps, with time zero at tskew = 0. Display the waveforms for tpDH and tpLH (maximum and minimum values must be legible) to show how the times were obtained. Indicate how the requested times were measured (use small steps for the simulation, e.g., 5ps). Plot the analyzed time versus skew (vertical axis showing tpDH and tpLH values, and horizontal axis showing tskew).
I managed to generate the rise and fall delay times and the skew, as well as the calculation involving the formula (TpLH/TpHL)*Skew (keeping in mind my variable VAR("Delay_B")). When that didn't work, I tried a "Wave vs. Wave" approach, but that didn't work either—resulting in the waveforms shown here.
I’d like to know if I did anything wrong, and also if there’s an easier way—something automatic—to get this function working