Facebook
 Google
 GitHub
 Linkedin
Beau Schwabe
- Joined Nov 7, 2019
- 186
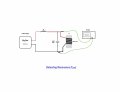
To answer a question in the simplest terms ... If the LC are in parallel you form a "notch filter" at resonance and the signal may be harder to detect. In series, you form a "pass filter" where at resonant frequency, the voltage can climb with orders of magnitude over the input voltage making it easier to detect.