Facebook
 Google
 GitHub
 Linkedin
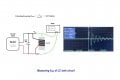
I have a few experiments planned for my students this coming half term, and one of them is to show how a coil and a capacitor in parallel will resonate at a specific frequency.
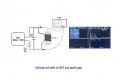
So I have an inductor made from 16 turns of plastic-coated wire on a plastic tube with a measured L = 6H. The capacitor in parallel measures 4.8nF, made from 2x10nF in series. The attached photo shows the planned arrangement.
The parasitic L and C will naturally drop the resonant frequency, and I'm not getting into that aspect in this demo, but I just want to show that a resonant response occurs somewhere and to note its value. Is the simplest way to drive the circuit with a signal generator set to square wave, 20V amplitude, 50% duty and sweep the frequency between 2 -10MHz? I would scope off the top and bottom of the capacitor.
Will that show anything, or do I need a more powerful stimulus, or another arrangement? I'm hoping that the signal generator input will make it 'ring' to some degree.
Thanks
")