Facebook
 Google
 GitHub
 Linkedin
hi everyone,
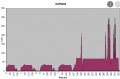
I'm interested to know what software or hardware you can build such graphs for consumption,
bootloading or starting the firmware,
performing any operations, and power consumption for esp8266,
I have seen several diagrams like this on the internet. and they are designed all differently.
Is it possible to plot a graph using a logic analyzer, or is only an oscilloscope suitable for this?
Thank you.
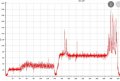
Attachments
-
 18.2 KB Views: 9
 -
 31.5 KB Views: 11
 -
 29.1 KB Views: 8