Facebook
 Google
 GitHub
 Linkedin
Hello,
I am trying to create a simulation that observes how pulsing a transistor affects the current over a range of temperatures. Here are my thoughts:
Using a .TEMP directive will provide a plot that displays the specified temperature range on the x axis while displaying current or voltage on the y axis.
Using a pulse voltage source, I can specify a 125 Hz signal (T=8ms) and use a period of 4ms to produce a 50% duty cycle for simple math. From my understanding PWM takes an attempt at producing an analog signal from a digital system. We either have a logical 0 or a logical 1. While using a PWM signal the average voltage over a sample of time, the period, is what we are interested in. For example, if a signal is low for half the time and high for half the time, the average voltage will be half of the max voltage. If each period utilizes a different duty cycle, this is were a digitally constructed analog signal is formed. With that in mind, in order to produce a proper PWM signal we must use a sample of time. This is where I believe my problem is. I cannot use the x axis to range temperature and time simultaneously.
It is very possible that I am thinking about this from the wrong perspective. I feel that simulating PWM(or duty cycle held at a set percentage), temp, and current must be simulated together.
PWM-ing the base of a npn transistor will have a different temperature curve in comparison to holding the base at a set DC voltage. Additionally, as the temperature curve changes the conductivity of the transistor will also change. I am a novice with circuits so please correct any details that I may have gotten incorrect.
To briefly summarize, I would like to see how discrete temperatures of [-40, -20, 0, 20, 40, 60, 80], affects the conductivity of the selected npn transistor at [20,40,60,80] percent duty cycle.
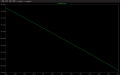
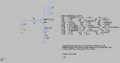
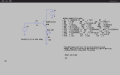
Screen shots of the dc and pulse circuit along with the resulting plots have been included. As shown in the plot images. Both plots are the exact same despite one circuit being supplied with 5V DC and the other using a 50 percent duty cycle with a max voltage of 5V.
Any advice regarding this matter would be greatly appreciated.
-Thank you
I am trying to create a simulation that observes how pulsing a transistor affects the current over a range of temperatures. Here are my thoughts:
Using a .TEMP directive will provide a plot that displays the specified temperature range on the x axis while displaying current or voltage on the y axis.
Using a pulse voltage source, I can specify a 125 Hz signal (T=8ms) and use a period of 4ms to produce a 50% duty cycle for simple math. From my understanding PWM takes an attempt at producing an analog signal from a digital system. We either have a logical 0 or a logical 1. While using a PWM signal the average voltage over a sample of time, the period, is what we are interested in. For example, if a signal is low for half the time and high for half the time, the average voltage will be half of the max voltage. If each period utilizes a different duty cycle, this is were a digitally constructed analog signal is formed. With that in mind, in order to produce a proper PWM signal we must use a sample of time. This is where I believe my problem is. I cannot use the x axis to range temperature and time simultaneously.
It is very possible that I am thinking about this from the wrong perspective. I feel that simulating PWM(or duty cycle held at a set percentage), temp, and current must be simulated together.
PWM-ing the base of a npn transistor will have a different temperature curve in comparison to holding the base at a set DC voltage. Additionally, as the temperature curve changes the conductivity of the transistor will also change. I am a novice with circuits so please correct any details that I may have gotten incorrect.
To briefly summarize, I would like to see how discrete temperatures of [-40, -20, 0, 20, 40, 60, 80], affects the conductivity of the selected npn transistor at [20,40,60,80] percent duty cycle.
Screen shots of the dc and pulse circuit along with the resulting plots have been included. As shown in the plot images. Both plots are the exact same despite one circuit being supplied with 5V DC and the other using a 50 percent duty cycle with a max voltage of 5V.
Any advice regarding this matter would be greatly appreciated.
-Thank you
Attachments
-
 161.3 KB Views: 10
 -
 292.2 KB Views: 10
 -
 163.1 KB Views: 9
 -
 328.8 KB Views: 9