Fourier series

MrAl

Joined Jun 17, 2014
13,709
Btw, why are there some pictures I cannot post to see directly but I have to click on
'''View attachment...'''
Aren't some of them posted as thumbnails? It's not that hard to click on them is it.

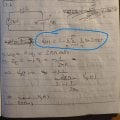
I'll check your new drawing out asap. It's looking neater now, good going :)
 

Thread Starter

linhvn

Joined Nov 6, 2024
297
So let me get this right now...

You are applying the wave shown in post #12 to the circuit with a 2 Ohm resistor and 1F capacitor and calculating the wave across the capacitor and finding the Fourier series for that output wave?
no, V source is already given in the blue circle in the 1st picture.
 

MrAl

Joined Jun 17, 2014
13,709
no, V source is already given in the blue circle in the 1st picture.
Hi,

Oh, so that function in the blue circle is a different problem with a different V(t) then?
So that V(t) is only given by the Fourier Series so far then?

So the V(t) in the blue circle, does that look like anything you have seen before?
Are you sure that is the right function as given to you? It very well may be I just want to double check with you first.

Here is the V(t) in post #12 if than helps any now.
 

Attachments

Thread Starter

linhvn

Joined Nov 6, 2024
297
Hi,

Oh, so that function in the blue circle is a different problem with a different V(t) then?
So that V(t) is only given by the Fourier Series so far then?

So the V(t) in the blue circle, does that look like anything you have seen before?
Are you sure that is the right function as given to you? It very well may be I just want to double check with you first.

Here is the V(t) in post #12 if than helps any now.
1741689497444.png
1741689531573.png
 

Thread Starter

linhvn

Joined Nov 6, 2024
297
Hi,

Oh, so that function in the blue circle is a different problem with a different V(t) then?
So that V(t) is only given by the Fourier Series so far then?

So the V(t) in the blue circle, does that look like anything you have seen before?
Are you sure that is the right function as given to you? It very well may be I just want to double check with you first.

Here is the V(t) in post #12 if than helps any now.
May I have attend some of your online class?
 

MrAl

Joined Jun 17, 2014
13,709
May I have attend some of your online class?
Hi,

I would like you to attend for sure, but I do not do that class anymore. It's mainly because I lost almost all the students after we got into simultaneous equations, and it was even just with two variables. Some people just do not like math, period. I am happy to see that you do not fall prey into that category as you seem to be doing very well.
Simultaneous equations, as I am sure you know, are not much of an extension of regular single variable algebra. If they all did not want to be bothered by that then how would they ever want to get into anything but the simplest circuit analysis problems, which was what the course was all about.

Math is one of the most valuable tools and really is necessary for advanced studies in almost all fields if not all. The more math we have, the better we are when it comes to this kind of study.
 

MrAl

Joined Jun 17, 2014
13,709
Hello again,

I just took a look at the first one above and it turns out it's fairly easy to get into that form. You just have to calculate the amplitude and phase shift of the filter and then combine it with the forcing function you already know (see attachment from post #19).

I'd be interested to hear about if you had tried this yet?
I see from that post you got the complex form right in that same post (before simplification), but were you able to convert it into the form shown in the first example with the n*sqrt(16*n^2*pi^2) in the denominator?
You need a form like that in order to plot the result so you can see what it looks like and compare to something else like a simulation. That can help to ensure you got the right result.
 

Attachments

Last edited:

Thread Starter

linhvn

Joined Nov 6, 2024
297
Hello again,

I just took a look at the first one above and it turns out it's fairly easy to get into that form. You just have to calculate the amplitude and phase shift of the filter and then combine it with the forcing function you already know (see attachment from post #19).

I'd be interested to hear about if you had tried this yet?
I see from that post you got the complex form right in that same post (before simplification), but were you able to convert it into the form shown in the first example with the n*sqrt(16*n^2*pi^2) in the denominator?
You need a form like that in order to plot the result so you can see what it looks like and compare to something else like a simulation. That can help to ensure you got the right result.
My final result is not the same with the answer in the book, the answer in the book has dc component = 3/2v, mine is 3. Btw , it seems that my photo has large size so I cannot find '' full image '' button, only see thumbnail.
View attachment 1741798444474.jpeg
1741798506597.png
 

MrAl

Joined Jun 17, 2014
13,709
My final result is not the same with the answer in the book, the answer in the book has dc component = 3/2v, mine is 3. Btw , it seems that my photo has large size so I cannot find '' full image '' button, only see thumbnail.
View attachment 344387
View attachment 344388
Hello again,

I must say, you did a great job with this problem. And yes, your answer is the right answer (see attachment for corrections) the 'book' answer must have messed something up.
It's good to see everything in one image too rather than make people scroll back to previous posts so I included the input information too all in one image.

There is one more little thing to say about this however, although you may already have noticed this.
That is, if we take the FIRST correction in the attachment (agrees with your result which is correct) and set t=0 and then sum for 'n' from 1 to infinity, we get a non-zero value. This value comes out to around 3 volts or a little more than that (I won't mention the exact value yet). But, how can that be true? When we apply a voltage Vs(t) as above to the circuit, at exactly t=0 the capacitor voltage cannot be anything other than 0 volts because the resistor prevents the capacitor from charging right away, it takes time for it to charge up to something like 3 volts.
So what is going on?

The thing about Fourier series solutions is that they don't always turn out to be correct for 'real' time, which starts at t=0 and progresses toward infinity. In particular, they don't always turn out right for time t=0 because they assume that time has started at minus infinity when for real applications, we usually start at t=0. What is missing is the exponential part of the solution, which is shown in the SECOND correction. Thus, if this were a real-world problem we would have to add the exponential part (and note K can turn out to have either a plus sign or a minus sign).

I should also note that for this problem you probably do not have to worry about that, because this "all time" solution is almost always acceptable in these Fourier problems. It's only when you have to come up with a real-world solution that you need to worry about that. That means you can deem your corrected answer as the right one for now.
If you would like to calculate the value of 'K' in the SECOND correction you can do that. It's just the value that causes the capacitor voltage to be at the right initial value at t=0.
It's interesting to note the difference in any case because this comes up sometimes and can get confusing when we do not see simulations match the Fourier solutions exactly and wonder what we did wrong.

[Side note: The exponential part for other circuit problems could be different than that shown as that one is for this problem only.]
 

Attachments

Last edited:

Thread Starter

linhvn

Joined Nov 6, 2024
297
Hello again,

I must say, you did a great job with this problem. And yes, your answer is the right answer (see attachment for corrections) the 'book' answer must have messed something up.
It's good to see everything in one image too rather than make people scroll back to previous posts so I included the input information too all in one image.

There is one more little thing to say about this however, although you may already have noticed this.
That is, if we take the FIRST correction in the attachment (agrees with your result which is correct) and set t=0 and then sum for 'n' from 1 to infinity, we get a non-zero value. This value comes out to around 3 volts or a little more than that (I won't mention the exact value yet). But, how can that be true? When we apply a voltage Vs(t) as above to the circuit, at exactly t=0 the capacitor voltage cannot be anything other than 0 volts because the resistor prevents the capacitor from charging right away, it takes time for it to charge up to something like 3 volts.
So what is going on?

The thing about Fourier series solutions is that they don't always turn out to be correct for 'real' time, which starts at t=0 and progresses toward infinity. In particular, they don't always turn out right for time t=0 because they assume that time has started at minus infinity when for real applications, we usually start at t=0. What is missing is the exponential part of the solution, which is shown in the SECOND correction. Thus, if this were a real-world problem we would have to add the exponential part (and note K can turn out to have either a plus sign or a minus sign).

I should also note that for this problem you probably do not have to worry about that, because this "all time" solution is almost always acceptable in these Fourier problems. It's only when you have to come up with a real-world solution that you need to worry about that. That means you can deem your corrected answer as the right one for now.
If you would like to calculate the value of 'K' in the SECOND correction you can do that. It's just the value that causes the capacitor voltage to be at the right initial value at t=0.
It's interesting to note the difference in any case because this comes up sometimes and can get confusing when we do not see simulations match the Fourier solutions exactly and wonder what we did wrong.

[Side note: The exponential part for other circuit problems could be different than that shown as that one is for this problem only.]
1742717402306.png
Do you know why this part (marked in red circle), they change from sine form to cosine form? I think keep sine form is right.
 

MrAl

Joined Jun 17, 2014
13,709
View attachment 345210
Do you know why this part (marked in red circle), they change from sine form to cosine form? I think keep sine form is right.
Hello again,

Did you put any effort into reconstructing the wave(s) yet? By that I mean once you get all the math figured out or even if you just read about it in the problem or on the web, can you PLOT the wave in a graph program, or alternately, just plot a few points of the resulting time domain waveform? This is very important because this can help to verify your results without needing any help from anyone else which makes you more independent with these questions.
For this problem, if you could plot the wave that should be the result I think it may shed some light on what is going on with your encircled question. If not, I'll try to show something more about this probably tomorrow, but you should at least attempt to plot these or else you'll be forever asking questions even after you are hired for some job in the real world :)
If you have trouble plotting problems like this we could go over a few.
 

Thread Starter

linhvn

Joined Nov 6, 2024
297
Hello again,

Did you put any effort into reconstructing the wave(s) yet? By that I mean once you get all the math figured out or even if you just read about it in the problem or on the web, can you PLOT the wave in a graph program, or alternately, just plot a few points of the resulting time domain waveform? This is very important because this can help to verify your results without needing any help from anyone else which makes you more independent with these questions.
For this problem, if you could plot the wave that should be the result I think it may shed some light on what is going on with your encircled question. If not, I'll try to show something more about this probably tomorrow, but you should at least attempt to plot these or else you'll be forever asking questions even after you are hired for some job in the real world :)
If you have trouble plotting problems like this we could go over a few.
So, you mean draw the waveform of Vsource?
 

MrAl

Joined Jun 17, 2014
13,709
So, you mean draw the waveform of Vsource?
Hi again,

Well that would be one plot yes, then plot the output of the circuit itself which in this case is the current i(t) which is the current we derive from the input and the circuit itself using the Fourier series. That would be after we include maybe 23 harmonics (n=1 to 23) or at the very least 7 harmonics (n=1 to 7). Using that many harmonics we can plot both the input Vs(t) and the current i(t) and see how they line up. It is a good idea to plot both on the same graph because then we can see the two plots line up in time, and it should of course make sense.

I'll try to keep my posts shorter so you can read them a little easier. BTW, what is your first language?
 

Thread Starter

linhvn

Joined Nov 6, 2024
297
Hi again,

Well that would be one plot yes, then plot the output of the circuit itself which in this case is the current i(t) which is the current we derive from the input and the circuit itself using the Fourier series. That would be after we include maybe 23 harmonics (n=1 to 23) or at the very least 7 harmonics (n=1 to 7). Using that many harmonics we can plot both the input Vs(t) and the current i(t) and see how they line up. It is a good idea to plot both on the same graph because then we can see the two plots line up in time, and it should of course make sense.

I'll try to keep my posts shorter so you can read them a little easier. BTW, what is your first language?
My 1st language is Vietnamnmese, I dont know why plotting the waveforms and why they have to change from sine to cosine related?
 

MrAl

Joined Jun 17, 2014
13,709
My 1st language is Vietnamnmese, I dont know why plotting the waveforms and why they have to change from sine to cosine related?
Hi,

I guess that is a reasonable question, but I would not have suggested it if they were not related.
To start with, just try to recreate v(t) from the Fourier coefficients, that could be a starting point for you.

The short answer, and I hate to point this out, is that using sin() may not work while using cos() may be required. You need to test that.
I have a feeling you never did a time domain recreation before? That could be part of the problem so I highly recommend you do at least one.
If you need an example I'll show you one. I really think you need to look into this.

The key is that if you cannot reproduce the original waveform(s) then you do not have the right solution yet, or you do not understand the right solution yet even when presented to you.
Could it even be that they provided the wrong solution for this or another problem? You should try to plot the wave(s) to find out.
My thoughts are that if you do it the way you think you can do it, it may not plot correctly. In other words, it may not work out to the right solution because the plot will not look reasonable and may even be very different than expected.

Did you try to reproduce the wave yet? There's another reason too. You have to know how the solution works out in the long run. If you don't know how to reproduce the wave then you only know how to find the Fourier coefficients (or whatever you need to find). How would you know if they are right or not if you were in a position where there was nobody around to ask?
The way this is done sometimes in programming is if you create a function F(x) as in y=F(x) then you should also create the inverse function x=G(y) so that you can test your programming. If you calculate say y=F(3.1415) then when you use your new inverse function x=G(y) then 'x' better come out to 3.1415 or else one of the functions is not working. When you finally get them both to work, then you have a very reasonable idea that both of the function are correct. With the Fourier series, recreating the waveform in the time domain proves you got BOTH ideas right, and for this problem that means you got the right Fourier coefficients or expression.

I hate to point out everything because it is good for you to discover a lot of this yourself because that prepares you better for the unknown.
I guess I should point out though that using sin() instead of cos() may not work. You need to test that idea or else you'll never know unless someone else tests it for you.

LATER:
I should also point out that another possibility is they just wanted to do it that way.
 
Last edited:

MrAl

Joined Jun 17, 2014
13,709
My 1st language is Vnmese, I dont know why plotting the waveforms and why they have to change from sine to cosine related?
Hello again,

Since you might be having trouble doing some of this I am providing an example. This shows how to reproduce the original wave from the Fourier Series coefficients. It's good to know how to do this because you can check your results and no matter what the error might be, you can tell because you won't get the plot you expect unless you had gotten the right coefficients.
I am writing the text part of the example right here and attaching the image part of the example. The image is the recreation of the original wave obtained from a limited number of coefficients.

Text: FourierExample_20250326-104914.txt
Image: FourierExampleImage_20250326-104914.png

Evaluating the Fourier Series coefficients for a square wave 10 units high.
The wave starts at t=0 and is 10 volts hign, then after the first half cycle it goes to zero (not negative).
The duty cycle is 50 percent. We can define the frequency later, but for now we assume that the first half
cycle runs from 0 to pi and is 10 volts high, and the second half cycle runs from pi to 2*pi and is zero volts.
This would be a frequency of 1/(2*pi) but we don't have to worry about that as long as we use those values.

Using these definitions (and ft is the square wave described above):
An=1/pi*integrate(ft*cos(n*t),t,a,b);
Bn=1/pi*integrate(ft*sin(n*t),t,a,b);
A0=limit(An,n,0)/2;
[And note we integrate from a=0 to b=pi. We don't have to also integrate from pi to 2*pi because that part of the wave is zero].

Calculating An tells us that An=0 except for A0 which will be 5 which is the DC offset.
Calculating Bn gives us (in the longer form):
Bn=10/(pi*n)-(10*cos(pi*n))/(pi*n);

and if we look at the results for Bn when we run n from 1 to say 5 we see that Bn is zero for n even
and for n odd it is:
Bn=20/(pi*n)

We have to remember though that this is for n odd only. That means we can not run n from 1 to say 15
unless we block out the even numbers for n. This isn't too much of a problem though.

Since that is the Bn then the wave we want to reconstruct will have a sum with elements:
F(t)=Bn*sin(w*n*t)

which comes out fairly simple:
F(t)=(20*sin(w*n*t))/(pi*n)

and this so far is without the DC offset value of 5.

Now to make this easier to sum, we can substitute n=2*k-1 so we get only odd numbers for n. This leads to:
F(t)=(20*sin((2*k-1)*t*w))/((2*k-1)*pi)

Now since w=2*pi*f and say we choose f=1Hz, then w=2*pi, so we substitute that in for w:
F(t)=(20*sin(2*pi*(2*k-1)*t))/((2*k-1)*pi)

Now we can sum that, say from 1 to 8 (which would be n odd only from 1 to 15), and we get:
F(t)=(4*sin(30*pi*t))/(3*pi)+(20*sin(26*pi*t))/(13*pi)+(20*sin(22*pi*t))/(11*pi)+(20*sin(18*pi*t))/(9*pi)+(20*sin(14*pi*t))/(7*pi)+(4*sin(10*pi*t))/pi+(20*sin(6*pi*t))/(3*pi)+(20*sin(2*pi*t))/pi

and now add the DC offset value of 5:
F(t)=5+(4*sin(30*pi*t))/(3*pi)+(20*sin(26*pi*t))/(13*pi)+(20*sin(22*pi*t))/(11*pi)+(20*sin(18*pi*t))/(9*pi)+(20*sin(14*pi*t))/(7*pi)+(4*sin(10*pi*t))/pi+(20*sin(6*pi*t))/(3*pi)+(20*sin(2*pi*t))/pi

This is the final waveform and matches the original f(t) except for the bumps. If we did the summation up to
some higher value of k (and thus n) we would see more bumps and a better match of the original waveshape.
 

Attachments

Top