E field plot

Thread Starter

ihaveaquestion

Joined May 1, 2009
314
Hi all,

I'm trying to do a very simple plot of E field as a function of theta with 0 <= theta >= 90 for the following E field:

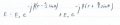
E = exp(-1j*k*(r-(a/2)*sin(theta)))+exp(-1j*k*(r+(a/2)*sin(theta)));

I've attached a picture of the E function in handwriting which may be easier to see... (I hope my express above matches)

Here is my code (assumptions made are that E\(_{}o\): is 1 and a/r =0, i.e., r >> a... also k = \(\beta\))

r = 1000;
lam = 1;
a = lam/4;
k = 2*pi/lam;
theta = 0:5:90;
x = exp(-1j*k*(r-(a/2)*sin(theta)))+exp(-1j*k*(r+(a/2)*sin(theta)));
plot(theta,x);
xlabel('theta');
ylabel('E');

Is this correct?

Thanks a lot everyone
 

Attachments

Last edited:

someonesdad

Joined Jul 7, 2009
1,583
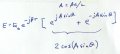
You don't say whether you want the real or imaginary part (I assume you mean j is the unit imaginary). Unless I screwed up on my algebra, this expression can be simplified to a complex exponential times a cosine (see attached).

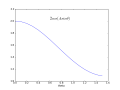
I've also attached a plot of this function I made using python, numpy, and matplotlib.

Rich (BB code):
from pylab import *
theta, A = arange(0, pi/2, 0.1), 1
plot(theta, 2*cos(A*sin(theta)))
xlabel('theta')
text(0.6, 2, r"$2cos(A sin \theta)$", size=18)
savefig("cos_term.png", dpi=75)
 

Attachments

Thread Starter

ihaveaquestion

Joined May 1, 2009
314
Yes, I think you're right about just taking the real part.... is there a command in MATLAB to just take the real part of the function to avoid any algebra errors?

Would it also be possible for you to please post the magnitude of E as a function of theta with theta sweeping from 0 to 90? I'd like to see if our graphs match... thanks
 

someonesdad

Joined Jul 7, 2009
1,583
I don't have or use Matlab, so I can't help you. It's easy to do in python though (and the nice thing about the python tools is that they are open source and free).

I did plot the function of theta -- see the second image in my post above. That curve is just multiplied by a complex exponential in r, which you can take as a constant, as it won't change as theta varies.

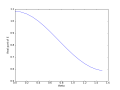
But since it's trivial to do in python, here's the code to plot the E function you gave (I just set the constants to convenient values):

Rich (BB code):
from pylab import *
theta, A = arange(0, pi/2, 0.1), 1
a, r, k = 2, 1, 1
E = exp(-1j*k*(r - a/2*sin(theta))) + exp(-1j*k*(r + a/2*sin(theta)))
plot(theta, E.real)
xlabel('theta')
ylabel('Real part of E')
The plot is attached. BTW, the folks who wrote the matplotlib library I use for plotting modeled it after Matlab, so it's possible the Matlab code is quite similar to the python code. One nice feature of matplotlib is that you can put equations and text on the screen anywhere and in the titles and axis labels. Makes it easier to produce useful plots.
 

Attachments

Top