Facebook
 Google
 GitHub
 Linkedin
This turned up an interesting result. It turns out that some cap ESR actually reduces the peak tp peak ripple. That is, an ESR other than zero could reduce the peak to peak ripple although going too high increases the ripple. No attempt to find the optimum ESR has been made yet, but here are some numerical results from the calculations.
The change in ripple seems to be numerically based on the ratio of the cap ESR to the series resistor value.
The frequency used was 100Hz and the peak input voltage was 1000v.
The results are shown in the text below and their descriptions below that.
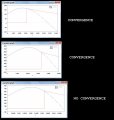
The first image shows a graphical check on convergence of the algorithm. It is used as a secondary check while the primary check is numerical (t3x must equal the 1/2 cycle period of the input line frequency). The graphics show the output voltage where the blue wave is the output while the diodes are 'on' and the red wave is the exponential when the diodes are 'off'. If the two do not meet at the upper point of the red wave then convergence had not been reached yet. The third image in that series clearly shows non convergence. Note the first image in that series is from a different study with different component values so the result values are not nearly the same.
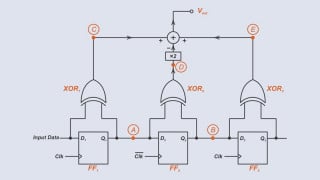
The second image shows the circuit with R3 which is the cap ESR.
Note the BRIDGE RECTIFIER is a regular four diode rectifier bridge.
The text below shows various values as shown below that.
The fourth from last number shows the peak to peak ripple. This is the difference between the peak voltage and the lowest voltage after the exponential. The numbers go down as we go down in ESR but then go up again as we get lower. I think that's incredibly interesting and probably caused by the energy used by the cap ESR.
Take a look see what you think.
Here are the numbers in text form
in order:
[R3,t3x,t1x,t2x,tr1,tr2,vp1,vp2,Vpp,Vavg,vx1,vx2];
with R3=1.6 Ohms:
[1.6, 0.005, 7.0673092063690225*10^-4, 0.0033204354727037, 0.0020841320976865, 0, 743.3290092214019, 429.6021327954099, 313.7268764259919, 596.2407062426768, 429.6021327954099, 573.8910665061078]
with R3=0.8 Ohms:
[0.8, 0.005, 7.4981752577810883*10^-4 ,0.003144979634584, 0.0021956220820767, 0, 743.0524046795306, 453.8883411338138, 289.1640635457168, 607.6377545559436, 453.8883411338138, 639.9394183496933]
with R3=0.4 Ohms:
[0.4, 0.005, 7.714650964983521*10^-4 ,0.0030399904167267, 0.0022756771845408, 0, 749.2773153747877, 465.9657781512864, 283.3115372235013, 614.2426078697715, 465.9657781512864, 679.2825134456205]
with R3=0.2 Ohms:
[0.2, 0.005, 7.8199065345202013*10^-4 ,0.0029821282614894, 0.0022756771845408, 0, 755.0233302069833, 471.8071021927378, 283.2162280142454, 617.75030108164, 471.8071021927378, 700.8061711551655]
with R3=0.1 Ohms:
[0.1, 0.005, 7.8710994643922975*10^-4 ,0.0029517032349671, 0.0022756771845408, 0, 758.6341587069893, 474.6406915644735, 283.9934671425158, 619.5452518689522, 474.6406915644735, 712.0594454926728]
and with R3=0 we get:
[0.0, 0.005, 7.9209823816306759*10^-4 ,0.0029202234908378, 0.0022756771845408, 0, 762.8131599242712, 477.3970466013168, 285.4161133229544, 621.3608474979944, 477.3970466013168, 723.6470903616714]
R3 is the cap ESR value,
t3x is the check on the 1/2 cycle time, for 100Hz this is 0.005
t1x is input sine delay time (diodes turn on),
t2x is diode 'on' time (diode dwell time),
tr1 is time to peak,
tr2 is time to valley (made zero rather than 1/2 cycle time),
vp1 is peak voltage (highest point on waveform),
vp2 is valley voltage (lowest point on waveform),
Vpp is peak to peak voltage (vp1-vp2),
Vavg is average DC voltage (entire waveform integrated over 1/2 cycle),
vx1 is lowest voltage point (should be the same as vp2),
vx2 is highest voltage point.
The change in ripple seems to be numerically based on the ratio of the cap ESR to the series resistor value.
The frequency used was 100Hz and the peak input voltage was 1000v.
The results are shown in the text below and their descriptions below that.
The first image shows a graphical check on convergence of the algorithm. It is used as a secondary check while the primary check is numerical (t3x must equal the 1/2 cycle period of the input line frequency). The graphics show the output voltage where the blue wave is the output while the diodes are 'on' and the red wave is the exponential when the diodes are 'off'. If the two do not meet at the upper point of the red wave then convergence had not been reached yet. The third image in that series clearly shows non convergence. Note the first image in that series is from a different study with different component values so the result values are not nearly the same.
The second image shows the circuit with R3 which is the cap ESR.
Note the BRIDGE RECTIFIER is a regular four diode rectifier bridge.
The text below shows various values as shown below that.
The fourth from last number shows the peak to peak ripple. This is the difference between the peak voltage and the lowest voltage after the exponential. The numbers go down as we go down in ESR but then go up again as we get lower. I think that's incredibly interesting and probably caused by the energy used by the cap ESR.
Take a look see what you think.
Here are the numbers in text form
in order:
[R3,t3x,t1x,t2x,tr1,tr2,vp1,vp2,Vpp,Vavg,vx1,vx2];
with R3=1.6 Ohms:
[1.6, 0.005, 7.0673092063690225*10^-4, 0.0033204354727037, 0.0020841320976865, 0, 743.3290092214019, 429.6021327954099, 313.7268764259919, 596.2407062426768, 429.6021327954099, 573.8910665061078]
with R3=0.8 Ohms:
[0.8, 0.005, 7.4981752577810883*10^-4 ,0.003144979634584, 0.0021956220820767, 0, 743.0524046795306, 453.8883411338138, 289.1640635457168, 607.6377545559436, 453.8883411338138, 639.9394183496933]
with R3=0.4 Ohms:
[0.4, 0.005, 7.714650964983521*10^-4 ,0.0030399904167267, 0.0022756771845408, 0, 749.2773153747877, 465.9657781512864, 283.3115372235013, 614.2426078697715, 465.9657781512864, 679.2825134456205]
with R3=0.2 Ohms:
[0.2, 0.005, 7.8199065345202013*10^-4 ,0.0029821282614894, 0.0022756771845408, 0, 755.0233302069833, 471.8071021927378, 283.2162280142454, 617.75030108164, 471.8071021927378, 700.8061711551655]
with R3=0.1 Ohms:
[0.1, 0.005, 7.8710994643922975*10^-4 ,0.0029517032349671, 0.0022756771845408, 0, 758.6341587069893, 474.6406915644735, 283.9934671425158, 619.5452518689522, 474.6406915644735, 712.0594454926728]
and with R3=0 we get:
[0.0, 0.005, 7.9209823816306759*10^-4 ,0.0029202234908378, 0.0022756771845408, 0, 762.8131599242712, 477.3970466013168, 285.4161133229544, 621.3608474979944, 477.3970466013168, 723.6470903616714]
R3 is the cap ESR value,
t3x is the check on the 1/2 cycle time, for 100Hz this is 0.005
t1x is input sine delay time (diodes turn on),
t2x is diode 'on' time (diode dwell time),
tr1 is time to peak,
tr2 is time to valley (made zero rather than 1/2 cycle time),
vp1 is peak voltage (highest point on waveform),
vp2 is valley voltage (lowest point on waveform),
Vpp is peak to peak voltage (vp1-vp2),
Vavg is average DC voltage (entire waveform integrated over 1/2 cycle),
vx1 is lowest voltage point (should be the same as vp2),
vx2 is highest voltage point.
Attachments
-
 90.7 KB Views: 12
 -
 6 KB Views: 2
Last edited: