Facebook
 Google
 GitHub
 Linkedin
I have been asked to confirm that the propagation characteristics of a transmission line, with the given parameters
R= 2.2 Ohm, L = 105nH, C = 69pF, G = 14 nS.
Along with these two equations,

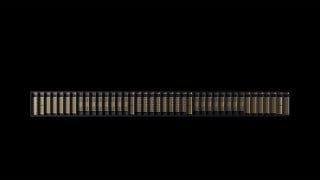
I have been able to confirm all except the phase coefficient (Beta) againt frequency. The given characteristic plot being:

However when running my MATLAB Code:
I get this plot;

I am confused as to why at higher frequencies the two lines don't merge like in the characteristic plot
R= 2.2 Ohm, L = 105nH, C = 69pF, G = 14 nS.
Along with these two equations,
I have been able to confirm all except the phase coefficient (Beta) againt frequency. The given characteristic plot being:
However when running my MATLAB Code:
Code:
% Constants
R = [2.2];         % ohm m^-1
L = [105]*1e-9;        % H m^-1
C = [69]*1e-12;         % F m^-1
G = [14]*1e-9;         % S m^-1

% Frequency range
f = logspace(0,30);     % Hz

w=(2*pi*f); %Freq in rad/sec

y=sqrt(R+(1i.*w.*L)).*(G+(1i.*w.*C));

alpha = real(y);
beta = imag(y);

% Characteristic impedance
Zo = sqrt((R + 1i*2*pi*f.*L)./(G + 1i*2*pi*f.*C));
% Plot results
loglog(f, 2*pi*f*sqrt(L*C));
xlabel('Frequency (Hz)');
ylabel('Phase Coefficient');
title('Phase Coefficient vs Freq');

hold on
loglog(f, beta);

grid on;

print -deps PhaseCoeffVSFreqPlot
I am confused as to why at higher frequencies the two lines don't merge like in the characteristic plot