Open loop bodeplot of an improved Howland circuit

Thread Starter

adinesh

Joined Sep 9, 2019
20
Hello,

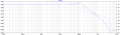
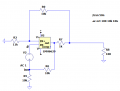
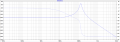
I am currently working on an improved howland current pump. I wanted to know if the open loop bodeplot I have plotted is correct because I see the magnitude is negative and also I am confused how to measure the open loop gain of this circuit(attached is the way I have measured). Any leads would be great!

Thanks
 

Attachments

ericgibbs

Joined Jan 29, 2010
18,766
hi adinesh,
Welcome to AAC,
Please post your LTS asc file and any models that you have in the circuit, we can then run the simulation.
E
 

danadak

Joined Mar 10, 2018
4,057
R7, R8 produce 20 db down for starters.

You have significant G peaking in the Bode plot, so transient response
will have a lot of ringing in it.

You have + DC fdbk, I am suspicious this will cause latchup of the OpAmp.


Regards, Dana.
 

crutschow

Joined Mar 14, 2008
34,280
R2, R5, R6, and R9 should all be equal to minimize that large peak in the gain, which is likely caused by the positive feedback being greater than the negative feedback in your circuit (why did you do that?).

You are measuring the closed-loop gain.
Why do you want to measure the open-loop gain, which is essentially the op amp gain?

I don't understand your Bode plot as you seem to be measuring the gain across the input source, which should be 1 or 0dB. :confused:
 
Last edited:

Thread Starter

adinesh

Joined Sep 9, 2019
20
hi adinesh,
Welcome to AAC,
Please post your LTS asc file and any models that you have in the circuit, we can then run the simulation.
E
Thanks for the reply Eric! I have attached my LTC asc file and also the opamp model I am using. It would great if you could let me know how to plot the open loop bodeplot of this circuit because I need to know the stability behavior of it.

Regards, Adinesh
 

Attachments

Thread Starter

adinesh

Joined Sep 9, 2019
20
R7, R8 produce 20 db down for starters.

You have significant G peaking in the Bode plot, so transient response
will have a lot of ringing in it.

You have + DC fdbk, I am suspicious this will cause latchup of the OpAmp.


Regards, Dana.
Hi Dana,

Thanks for your reply! As I am a starter in circuit designing, it would be great if you could answer my doubts down here:

R7, R8 produce 20 db down for starters - I do not exactly get the point why the whole plot is shifted? Does this mean my circuit is unstable?

You have significant G peaking in the Bode plot, so transient response will have a lot of ringing in it - About the gain peaking, Yes I have to apply some compensation to reduce the peaking.

You have + DC fdbk, I am suspicious this will cause latchup of the OpAmp - But the resistor values are calculated according to the design of an improved howland circuit. Did you mean that the +ve DC feedback is causing the gain peaking?

Regards, Adinesh
 

Thread Starter

adinesh

Joined Sep 9, 2019
20
R2, R5, R6, and R9 should all be equal to minimize that large peak in the gain, which is likely caused by the positive feedback being greater than the negative feedback in your circuit (why did you do that?).

You are measuring the closed-loop gain.
Why do you want to measure the open-loop gain, which is essentially the op amp gain?

I don't understand your Bode plot as you seem to be measuring the gain across the input source, which should be 1 or 0dB. :confused:
Thanks for your reply! I have used different R2 value because I had to match the R2=R9+R7 condition of improved howland current source. To reduce gain peaking, I am working on implementing some compensation techniques.

I have attached the closed loop plot for your reference(where I did not understand why the magnitude plot starts from -20dB?). The previous picture was actually a try to measure the open loop gain. And I am trying to plot the open loop bodeplot because I need to study the stability of this circuit.

It would be great if you could help me understand how to plot the open loop bodeplot of this circuit.

My apologies if I made any technically wrong statement above since I am new to circuit designing!:p

Best Regards
 

Attachments

ericgibbs

Joined Jan 29, 2010
18,766
hi adinesh,
Downloaded your asc and LMH files OK, the sim is reporting cannot find SNMO340.cir, I have searched the Web and LTS for the 'cir' , no success.
E
 

Thread Starter

adinesh

Joined Sep 9, 2019
20
hi,
A simple Rload sweep.
E
hi,
thank you so much Eric for the responses. But unfortunately, I can't go very low on R3 value because my application specifies load current of 2uA-2mA and If R3 is made 100, the supply voltage would be 0.2mV which is not practically good to be generated on a waveform generator.

Regards, Adinesh
 

Thread Starter

adinesh

Joined Sep 9, 2019
20
What is the range of the load resistance?
What frequency response is desired?
What is the input signal voltage range?
Hi Eric, Please find below my answers:

What is the range of the load resistance - 100 to 1k
What frequency response is desired - Flat band upto 150-200MHz
What is the input signal voltage range - 20mV to 2V

Adinesh
 

crutschow

Joined Mar 14, 2008
34,280
What is the range of the load resistance - 100 to 1k
For 2mApk through the maximum load resistance of 1k requires a peak voltage of 2V.
The lmh6629 op amp has a maximum output of 4V (below) with a 5V supply voltage (6V max), and thus only 1.5Vpk with a ±2.5V supply.
You need a higher voltage rated op amp, assuming you need a bipolar plus and minus output current.

upload_2019-9-10_9-12-25.png
 
Last edited:
Top