Facebook
 Google
 GitHub
 Linkedin
Hi,
I am currently trying to determine the open-loop frequency response of an opamp circuit with LTSpice. For doing this, I used the following videos from Linear Technology and Texas Instruments as reference:
1)
2)
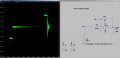
Unfortunately, the results are not plausible. You can see the results of a transient simulation with a step input in the picture "transient1.jpg". A strong overshoot with ringing can be seen, which indicates a low phase margin imho. The corresponding simulation file is "opamp_differentiator.asc".
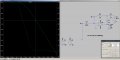
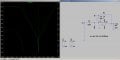
The AC analysis according to Video (1) is shown in the picture "ac_analysis1.jpg". However, the frequency response is totally implausible because the gain never reaches 0dB, so the phase margin is undefined. According to my understanding, the circuit should be unstable in this situation. (The corresponding simulation file is "opamp_differentiator2.asc".)
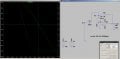
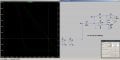
The AC analysis according to Video (2) is shown in the picture "ac_analysis2.jpg". According to this result the phase margin is 90°. I think this is implausible, because with such a large phase margin the step response ("transient1.jpg") wouldn't look like this. (The corresponding simulation file is "opamp_differentiator3.asc".)
Apart from the weird simulation results, it also bothers me that both methods give completely different results.
What am I doing wrong?
LT-Spice-Version: 24.0.12 with Whine in Linux
I am currently trying to determine the open-loop frequency response of an opamp circuit with LTSpice. For doing this, I used the following videos from Linear Technology and Texas Instruments as reference:
1)
Unfortunately, the results are not plausible. You can see the results of a transient simulation with a step input in the picture "transient1.jpg". A strong overshoot with ringing can be seen, which indicates a low phase margin imho. The corresponding simulation file is "opamp_differentiator.asc".
The AC analysis according to Video (1) is shown in the picture "ac_analysis1.jpg". However, the frequency response is totally implausible because the gain never reaches 0dB, so the phase margin is undefined. According to my understanding, the circuit should be unstable in this situation. (The corresponding simulation file is "opamp_differentiator2.asc".)
The AC analysis according to Video (2) is shown in the picture "ac_analysis2.jpg". According to this result the phase margin is 90°. I think this is implausible, because with such a large phase margin the step response ("transient1.jpg") wouldn't look like this. (The corresponding simulation file is "opamp_differentiator3.asc".)
Apart from the weird simulation results, it also bothers me that both methods give completely different results.
What am I doing wrong?
LT-Spice-Version: 24.0.12 with Whine in Linux
Attachments
-
 145.6 KB Views: 8
 -
1.2 KB Views: 0
-
 176.7 KB Views: 8
 -
1.3 KB Views: 0
-
 203.8 KB Views: 9
 -
1.5 KB Views: 0