JFET - transconductance

AlbertHall

Joined Jun 4, 2014
12,652
The problem could also be solved graphically by drawing a tangent to the line on the graph and then calculating the slope of that line.
 

MrAl

Joined Jun 17, 2014
13,785
Hi,

Using a second degree fit in a limited range i get a slope around 0.9 which is close to what Electrician would get with his fit. The range i used was limited to 1ma to 3ma, and although it is still not a parabola the fit isnt too bad for this kind of graphical analysis problem.
The characteristic of this curve is a little more 'curvy' than a true parabola. I would think that a 3rd degree fit would help this quite a bit although the ratio of two polynomials that Electrician used works too. I dont think the required accuracy of this problem warrants going too far with this though. We could fit 100 points and see how it differs.

This is the quick 2nd degree fit using just 3 points on the curve:
y=(325*x^2)/1938+(10565*x)/7752+9249/2584

although again the range must be limited to within 1ma to 3ma which encompasses the point of interest.

Another small point is that the graphical image is not properly aligned with the presumed orthogonal axes. There is a slight pincushion effect that would have to be taken into account if we wanted better accuracy. This probably came about as a result of the camera distorting the curvature a little. We'd have to apply a spatial transformation to adjust the values we get when assuming the graphic is perfectly square. For example, the x axis appears rotated by 1.4 degrees counter clockwise from the horizontal, and the y axis appears rotated clockwise. It's not really rotated though as it is a variable rotation which depends on spatial position.. This would make a slope near the left side bottom appear slightly more steep and a slope near the right side top slightly less steep. It's not much though so we can probably ignore this effect.
A second look though says that maybe it was just the camera angle that affected the squareness. This is very typical when the plane of the camera lens is not positioned at the same spatial angle as the subject plane. The corrective transformation would be a little different then.
 
Last edited:
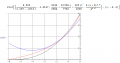
I also noticed the distortion of the given curve; the distance between 3 mA and 4 mA is substantially larger than between 0 mA and 1 mA. However, just doing a graphical estimation using a straight edge on the image, the slope is definitely less than 1 mS.

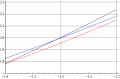
Just for grins, here's a superposition of the three analytical approximations to the problem curve. Mine is red, MrAl's is blue and Bordodynov's is black.

It appears that Bordodynov's has too little slope at the left side, too much near the 2 mA point and again too little at the far right.

Fetx2.png

Here it is zoomed in around the region of interest.

Fetx3.png
 

MrAl

Joined Jun 17, 2014
13,785
I also noticed the distortion of the given curve; the distance between 3 mA and 4 mA is substantially larger than between 0 mA and 1 mA. However, just doing a graphical estimation using a straight edge on the image, the slope is definitely less than 1 mS.

Just for grins, here's a superposition of the three analytical approximations to the problem curve. Mine is red, MrAl's is blue and Bordodynov's is black.

It appears that Bordodynov's has too little slope at the left side, too much near the 2 mA point and again too little at the far right.

View attachment 123559

Here it is zoomed in around the region of interest.

View attachment 123560
Hello again,

That's a nice idea there. It would be nice to see the original graph with those three, so we can compare directly. Also, my solution is not meant to be used for the full range, it was only made for the range 1ma to 3ma. When i superimposed it on the original graph it looked pretty close within that range.
Note i did not yet do a fit that makes up for the graphic aberration yet. I may have rotated it 1.6 degrees first however, i forgot about that.
 
Last edited:
Top