Your meter may be reading the peak voltage of your output when measuring DC voltages. The peak voltage of a sine wave is about 1.4 times the RMS voltage.
The filter capacitor charges to the peak voltage. Your meter will read the peak voltage when set to DC volts.
Your meter may be reading the peak voltage of your output when measuring DC voltages. The peak voltage of a sine wave is about 1.4 times the RMS voltage.
The filter capacitor charges to the peak voltage. Your meter will read the peak voltage when set to DC volts.
AC voltages are specified by RMS values.
The amplitude of the sine wave is the RMS value multiplied by the square root of 2.
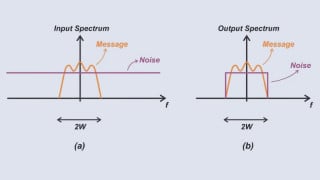
When the AC signal is rectified, there is still a huge ripple voltage even though it is DC. What your volt meter will indicate will depend on the design of the voltmeter.
When a capacitor is charged with the rectified DC voltage the capacitor will tend to hold the voltage at the peak voltage. If the charge is allowed to discharge through a load attached to the capacitor then the voltage will fall in between the peak cycles. Hence you will measure a lower average voltage depending on the value of the capacitance and the value of the load.
AC voltages are specified by RMS values.
The amplitude of the sine wave is the RMS value multiplied by the square root of 2.
When the AC signal is rectified, there is still a huge ripple voltage even though it is DC. What your volt meter will indicate will depend on the design of the voltmeter.
When a capacitor is charged with the rectified DC voltage the capacitor will tend to hold the voltage at the peak voltage. If the charge is allowed to discharge through a load attached to the capacitor then the voltage will fall in between the peak cycles. Hence you will measure a lower average voltage depending on the value of the capacitance and the value of the load.
So is the peak voltage dependent on the capacitance of the capacitor..let me just list the breakdown..220v in - 33v out(transformer secondary) - 40v (rectifier out) - 48v (low pass filter)
The peak voltage will always be the same to a great degree, with a capacitor on the bridge output, the mean level will depend on load.
The peak to peak voltage will not be maintained if the capacitor is drained off between peaks.
Max.
The peak voltage will always be the same to a great degree, with a capacitor on the bridge output, the mean level will depend on load.
The peak to peak voltage will not be maintained if the capacitor is drained off between peaks.
Max.
Here's a chart of this that I plotted some years ago. It shows how, as C increases, the time-average voltage after a rectifier-plus-filter-cap increases for a given load R.
The blue line shows the lower limit, which is the time-average voltage factor for a sine wave, ~0.635. That's what you get if the cap is too small to really do anything. The black line is the upper limit, the peak of the sine wave. That's what you get with low load (= high R) and a big C.
The red line shows what you get at points in between. It's the time-weighted average, which is to necessarily what you will see from a typical cheap meter.
edit - the x-axis is the RC time constant of the filter cap C and load R, times the frequency.
 Facebook
 Google
 GitHub
 Linkedin