Facebook
 Google
 GitHub
 Linkedin
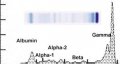
I'd like an advice about converting an image like the attached helab3.jpg to histograms. Which program can do this conversion?
This is about electrophoresis film.
Thanks,
Ioannis
This is about electrophoresis film.
Thanks,
Ioannis
Attachments
-
 5.3 KB Views: 28
 -
 6.7 KB Views: 26
 -
 257 KB Views: 28