Facebook
 Google
 GitHub
 Linkedin
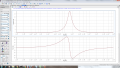
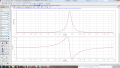
Okay I got them (figured out how to do it properly using maple)
Did them for Q=4, will do Q=2 as well so that we're all at the same point
EDIT:
I adjusted A to get 10dB and here's what I got ....still for Q =4.
Did them for Q=4, will do Q=2 as well so that we're all at the same point
EDIT:
I adjusted A to get 10dB and here's what I got ....still for Q =4.
Attachments
-
 169.7 KB Views: 10
 -
 176.9 KB Views: 10
 -
 177.6 KB Views: 11
 -
 182.7 KB Views: 11
Last edited:


")