Facebook
 Google
 GitHub
 Linkedin
Oh sorry about that, didn't know that's what you had meant.
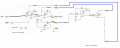
I edited it to add in some more labels so it would be consistent with what I wrote out.
And yes your MFB is correct, I derived that MFB eqn from another circuit which had R3 and R2 basically in the other positions, I didn't even notice it was oriented differently there in this circuit.
Ohh I see, I analyzed it with the pot in any arbitrary position. My goal was to do it for any position so that I can substitute Ra and Rb accordingly for any boost/cut. And well of course Ra= 0 for Full boost or Rb=0 for Full cut.
Hello again,
Well when you assign values for the pot you are analyzing for any pot position, you just wait till later to set those values.
I might also point out that if we say:
"The gain is dependent on A"
that does not mean that it cant be A+1 or even A+2, just that A is a big factor in determining the gain because if you change A you change the gain. So that could be why we are seeing A+1 instead of the presumed A.


")