Help needed to draw excel line chart

Thread Starter

logearav

Joined Aug 19, 2011
243
Revered members,
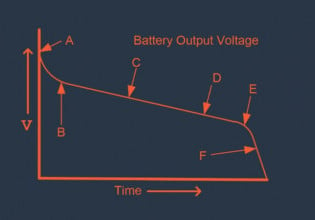
I just now bought MsOffice 2010. I need to draw a graph similar to my attachment in Excel 2010. I dont know how to do this in Excel. I used the help option in office but i can't understand. Please guide me how to draw. As i am a physics student line graph is essential to me.
 

Attachments

holnis

Joined Nov 25, 2011
49
First of all ! make sure that there is some data in your excel sheet and that your excel sheet does not contain any blank cells between the different columns, then click the Insert 'menu' and choose the chart type that you wish to draw.

Once the chart is drawn, it becomes very easy to change the attributes, right-click the chart and you will see the options for changing chart types, data, and other formatting.

That's it, Hope this helps :)
 

Thread Starter

logearav

Joined Aug 19, 2011
243
Thanks for the reply. I have attached the screen shots the the graph i got. I didn't get what i wanted as mentioned in OP
 

Attachments

atferrari

Joined Jan 6, 2004
4,767
In much less time that it takes to post here you could try ALL the graphic options you have. Is that simple.
 
Last edited:

justtrying

Joined Mar 9, 2011
439
the graph you got drew two lines using row numbers for x-axis and column A and B data for y axis producing two graphs. If you want to use column A for x and column B for y axis data, select scatter graph, if you right click on the actual series label, you should be able to select data - as in select data you want for x-axis and y-axis. You can use select data function to edit line graph as well. If you need to have a line drawn though the scatter plot, right click on the points on the graph and go to "add trendline", you want linear.

hope this helps
 

joeyd999

Joined Jun 6, 2011
5,283
the graph you got drew two lines using row numbers for x-axis and column A and B data for y axis producing two graphs. If you want to use column A for x and column B for y axis data, select scatter graph, if you right click on the actual series label, you should be able to select data - as in select data you want for x-axis and y-axis. You can use select data function to edit line graph as well. If you need to have a line drawn though the scatter plot, right click on the points on the graph and go to "add trendline", you want linear.

hope this helps
The trendline function in excel is nearly useless! the LINEST function is far more versatile, and allows you to use the generated coefficients for other calculations in the spreadsheet. just my 2 cents...
 

justtrying

Joined Mar 9, 2011
439
The trendline function in excel is nearly useless! the LINEST function is far more versatile, and allows you to use the generated coefficients for other calculations in the spreadsheet. just my 2 cents...
Agree, it's useless if your data is non-linear, which is not the case here. I had a horrible time learning excel because there is no support, and still dislike using it ;) If you are going to point to advanced features like LINEST, maybe give a hint on how to use them?

http://www.excelfunctions.net/Excel-Linest-Function.html
 
Last edited:

joeyd999

Joined Jun 6, 2011
5,283
Agree, it's useless if your data is non-linear, which is not the case here.
No, the trendline option does allow for some limited non-linear curve fits. The problem is that your analysis ends there. There is no method to capture the generated coefficients into your worksheet (without manually transcribing the data). Usually, a curve fit is just the beginning of my analysis...not the end!

If you are going to point to advanced features like LINEST, maybe give a hint on how to use them?
Nah. I figure if someone is too lazy to Google, they're not worth the effort. I *like* leaving snippets of incomplete info that may send someone off onto some new random direction!

BTW, I don't use excel. I prefer LibreOffice.
 

evilclem

Joined Dec 20, 2011
118
Linest can be used for higher order polynomials within the excel spreadsheet. It's just a pain in the ass as you need to create new data columns with the x^2, x^3 values etc.
 

justtrying

Joined Mar 9, 2011
439
Nah. I figure if someone is too lazy to Google, they're not worth the effort. I *like* leaving snippets of incomplete info that may send someone off onto some new random direction!

BTW, I don't use excel. I prefer LibreOffice.
Sure, all in good fun if you know what you are looking for, otherwise hours of wasted time trying to find a link that provides you with valuable information. Sometimes it is good to just point to the source ;) just my 2 cents.
 

joeyd999

Joined Jun 6, 2011
5,283
Sure, all in good fun if you know what you are looking for, otherwise hours of wasted time trying to find a link that provides you with valuable information. Sometimes it is good to just point to the source ;) just my 2 cents.
Funny, when I spend hours on research (which I do nearly every single day), I never consider the time wasted. I very rarely walk away without having learned *something* valuable. Even if it wasn't what I was originally looking for!
 

Thread Starter

logearav

Joined Aug 19, 2011
243
the graph you got drew two lines using row numbers for x-axis and column A and B data for y axis producing two graphs. If you want to use column A for x and column B for y axis data, select scatter graph, if you right click on the actual series label, you should be able to select data - as in select data you want for x-axis and y-axis. You can use select data function to edit line graph as well. If you need to have a line drawn though the scatter plot, right click on the points on the graph and go to "add trendline", you want linear.

hope this helps
Thanks a lot justtrying. Now i want to add the label Voltage for X axis and Current for Y axis. How to do it?
 
Top