Facebook
 Google
 GitHub
 Linkedin
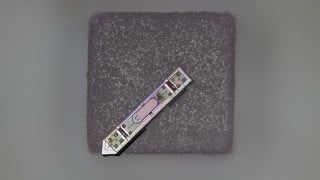
Take a photo and post it.Okay thanks! I have got some long wires and I am using a breadboard to wire everything so maybe they could be a source of noise. Other than that I am not too sure what else.
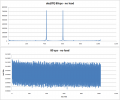
ADS1231: data conversion noise
- Thread starter kevinnas
- Start date
") hopefully it will be of use to both of us!
hopefully it will be of use to both of us!