Use a simulator to plot the frequncey response of the circuit

Thread Starter

leejohnson222

Joined Jan 11, 2023
57
What is the purpose of your last post? To show us again the same circuit which you have prsented in your 1st post?
well to see if it looks as it should with the simulation, i have never used one and i assume if i correctly put in the components it should display the right Ac sweep
 

MrAl

Joined Jun 17, 2014
13,769
well to see if it looks as it should with the simulation, i have never used one and i assume if i correctly put in the components it should display the right Ac sweep
Hello again,

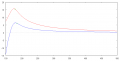
If you plot your response again using a smaller time step you should get a smoother curve.
I plotted two functions for an example and i am showing where the knee point probably is on both curves with a small green dot.
That's my best guess right now of where the point is they want to call the 'knee'.
Note i am not showing the entire curve, just that one part that looks like yours but smoother. This one starts at 150Hz.
 

Attachments

MrAl

Joined Jun 17, 2014
13,769
Hello again,

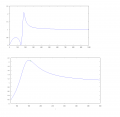
This might provide a clearer picture.

In the attached image, the top picture is a plot of the theoretical response using ideal components over a range of frequencies.
The bottom picture is a close up of that one peak over a narrower range of frequencies with the presumed 'knee' point marked with a small green dot.
In the top plot it is assumed that the first bump at the beginning is just a by-product artifact of the design, but to know for sure we would have to know the application.
 

Attachments

Thread Starter

leejohnson222

Joined Jan 11, 2023
57
ok i see what you mean, its hard to know if i am doing what they are looking for since i have to use a freq range of 10hz to 10khz i do think your graph shows it more clearly as a hp filter with knee point, I may hand in my work and see what feedback i get or ask for some clarification
what simulator is the one your using? does it allow you to create the circuit also? the one i found is a bit hard to follow
 

MrAl

Joined Jun 17, 2014
13,769
ok i see what you mean, its hard to know if i am doing what they are looking for since i have to use a freq range of 10hz to 10khz i do think your graph shows it more clearly as a hp filter with knee point, I may hand in my work and see what feedback i get or ask for some clarification
what simulator is the one your using? does it allow you to create the circuit also? the one i found is a bit hard to follow
Hi,

I use LT Spice and MicroCap, but those plots were obtained by doing the math for that circuit for the output you indicated and then plotting the response with Maxima. Maxima does most of the work even with the math, you just have to know how to write the equation(s) for the circuit, then you can plot the output response using that program also. It's not a simulator though, just a math program that can help solve equations and plot results.

LT Spice is a good choice because it's a widely used simulator and many other people on this forum use it too. That means you can quickly share your schematic file with others so they can go over your work and you can exchange ideas about the circuits. It does allow you to draw the circuit right on your computer screen.
 
Top