Facebook
 Google
 GitHub
 Linkedin
You may be measuring two different things. It appears the simulator is measuring the voltage across the 10 ohm R, the top with respect to the bottom. So the bottom is arbitrarily called 0V. Is that correct? But is that how you are measuring with the O-scope or are you measuring with respect to ground. Explain exactly how you are measuring the output with your scope. How many probes, are they 10X and have you compensated them, are you fastening the ground clip to your circuit -if so where, is the scope set for AC or DC coupling, what input impedance is selected for the scope, is the scope or any equipment floating or plugged in directly to the mains?
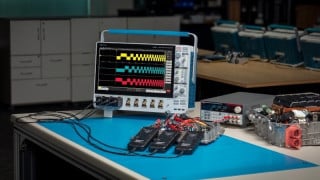
Can you show the output and input signals at the same time and give a better scope shot so we can see the voltages, and where the signal is with respect to ground, and compare input to output waveforms?
Can you show the output and input signals at the same time and give a better scope shot so we can see the voltages, and where the signal is with respect to ground, and compare input to output waveforms?