Simple calibration curve/formula for sensor. How?

Thread Starter

Toebs

Joined Oct 9, 2014
55
Hello

I have built a capacitive soil-moisture sensor.
And I have bought a reference hPa soil moisture sensor.

I basically want a formula so I can input a measurement from my capcitive sensor and it will then give me the hPa value as a result.

Heres is what I have done so far (don't know if it is right)
- I have placed the two sensors in the same soil pot, and I have collected some data.
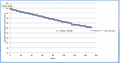
- I then put the data into excel and made a best fit curve for each data set.

So now i have two best fit curves.
Can I calculate a calibration formula from this, and if so how? :)
(uploaded pics of the two best fit curves from sensor data)
 

Attachments

Picbuster

Joined Dec 2, 2013
1,047
define the accuracy wanted.
next step calculate the (std) deviation for several points. ( You can still use formulae output as base)
make a table with corrections for each point.( correction table later used by mpu )
observe accuracy and repeat when necessary.
This is, as far as I know, the common way in T&M
 

Thread Starter

Toebs

Joined Oct 9, 2014
55
define the accuracy wanted.
next step calculate the (std) deviation for several points. ( You can still use formulae output as base)
make a table with corrections for each point.( correction table later used by mpu )
observe accuracy and repeat when necessary.
This is, as far as I know, the common way in T&M
Hi Picbuster. Thanks for the reply. To too see if I understood correctly:
I dont create a calibration curve but a calibration lookup table instead?
The calibration will run on a server in the back-end, so not on a mpu. Does this change method?
What is T&M?

How do I actually create the correction table from the standard deviation?
 

Picbuster

Joined Dec 2, 2013
1,047
Hi Picbuster. Thanks for the reply. To too see if I understood correctly:
I dont create a calibration curve but a calibration lookup table instead?
The calibration will run on a server in the back-end, so not on a mpu. Does this change method?
What is T&M?

How do I actually create the correction table from the standard deviation?
make sure that each sensor has it's own id number pointing to table at your backend.
Apply value to sensor read reference compare with your calibration curve and save in table.
calculate std deviation to see if result is within wanted spec's. if not you need more values.
table input = output from sensor
Table output = corrected value

float corrected_value(int sensor_ID, float measured_value)
// you can use sensor_ID to hang more information on (like day of purchase, brand, real serial number, day of calibration, calibrator)
 
I may be oversimplifying but can you not just plot hPa output against Cap output for data points with a common time reference?
if you do that you van construct a polynomial that gets you directly from Cap to hPa.

If your curve is too complex or the MCU/PLC instruction set cant handle the necessary maths then construct a lookup table, in an array, and use linear extrapolation the points.
When using basic PLC's I do this with address offsetting... I extract input points from the required curve with whole values and lookup the output value. Obviously you will want to scale the input to an appropriate range which is effectively the number of points.

Lets say you have 100 points from your Cap curve and the value of hPa for them.
Your input cap range is 10 to 20 so to use 100 points you multiply by 10 and subtract he offset.
now you have a reference with the same magnitude as your address range or array ordinal.

If the input is 15.57 it scales to 155.7 - 100 = 55.7 you cant look up 5.7 but you can look up 55 and 56 so do that.
Asume point 55 gives a value of 60 for hPa and point gives a value of 80.
you now assume the line between 55 and 80 on the hPa curve is linear.

Between 55 and 56 you have a difference of 1 so 0.7 is 70% of that.
between 60 and 80 you have a difference of 20, 70% of which is 14 so your return value is point 55, 60hPa + 14hPa =74hPa

If you can find a good polynomial representation of your curve, Cap to hPa, and calculate it in the MCU do that, if not construct a lookup with as many points as you can.
When I do this I plot the table in excel to see the approximation and tweek it by hand.

The more points you have the more accurate your output...

Al
 
Top