Siglent scope with SLA1016

Thread Starter

ApacheKid

Joined Jan 12, 2015
1,533
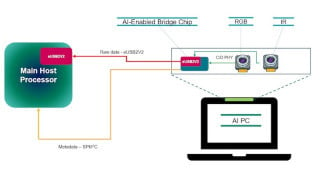
I've just started playing around with my scope and logic analyzer add-on I just purchased, take a look below:

1666394221752.png

This is just being driven by an analog signal generator producing a 5vpp square wave at about 40% duty cycle, just a random choice as I don't yet have a true digital system around to connect to just yet.

I do not understand the hex values, how is the system determining that the low period is 00F2 and the high period 00FA? what on earth is it using to determine these numbers? tweaking the duty cycle has no effect on these displayed hex numbers.

Another thing is that I can't really find any documentation on these settings, so I don't really understand what some of them mean, also I can't see how to select the color for a digital channel, like why can't I make D3 yellow for example?
 
Last edited:

nsaspook

Joined Aug 27, 2009
13,086
https://www.manualslib.com/manual/2105244/Siglent-Sds1000x-E-Series.html?page=202
Not really much there.

The colors are usually permanently assigned to the the digital probe tip as a signal visual tracing aid. If you want yellow, select and use the yellow probe line, easy.

TEK MSO2000 display example: The MSO logic analyzer is a very useful tool that takes a bit of hardware experience to use properly.
1666408033195.png
https://forum.allaboutcircuits.com/threads/blinky-prop-for-comic-con.127266/post-1038815
https://forum.allaboutcircuits.com/threads/oscilloscope-features.152317/post-1307422
https://forum.allaboutcircuits.com/threads/fifo-logic-block-meta-stability.136284/post-1143241
 
Last edited:

Irving

Joined Jan 30, 2016
3,845
I do not understand the hex values, how is the system determining that the low period is 00F2 and the high period 00FA? what on earth is it using to determine these numbers? tweaking the duty cycle has no effect on these displayed hex numbers.
You are driving D3. All other inputs are disconnected which, if selected for display are being measured as 1 because they are open circuit and if not selected for display are taken as 0, so clearly they are b1111x010 where x is your D3, hence the value read is either 0xF2 or 0xFA
 
Last edited:

Thread Starter

ApacheKid

Joined Jan 12, 2015
1,533
https://www.manualslib.com/manual/2105244/Siglent-Sds1000x-E-Series.html?page=202
Not really much there.

The colors are usually permanently assigned to the the digital probe tip as a signal visual tracing aid. If you want yellow, select and use the yellow probe line, easy.

TEK MSO2000 display example: The MSO logic analyzer is a very useful tool that takes a bit of hardware experience to use properly.
View attachment 279065
https://forum.allaboutcircuits.com/threads/blinky-prop-for-comic-con.127266/post-1038815
https://forum.allaboutcircuits.com/threads/oscilloscope-features.152317/post-1307422
https://forum.allaboutcircuits.com/threads/fifo-logic-block-meta-stability.136284/post-1143241
Just FYI I see no correlation between the color codes on the 16 tiny leads and the colors on the display, all of the digital signals appear to be a dull blue or green or reddish if that's the "active" one, the one we can move around or adjust settings for.
 

Thread Starter

ApacheKid

Joined Jan 12, 2015
1,533
You are driving D3. All other inputs are disconnected which, if selected for display are being measured as 1 because they are open circuit and if not selected for display are taken as 0, so clearly they are b1111x010 where x is your D3, hence the value read is either 0xF2 or 0xFA

Changing duty cycle has no effect as this is only concerned with logic levels not timing...
Thanks, that makes a lot of sense, much appreciated. I am confused though, but I found the manual, so I'm going to dive in...

Ahh - OK I can see that user can define a "bus" I fiddled with that but didn't really have any idea what it was doing. So by selecting - say - D0, D4 and D7 for example I defined a 3bit bus and the numeric value (bin/hex etc) is then the numeric representation of just those three signals where bit-0 is D0, bit-1 is D4 and bit-2 is D7...pretty cool stuff!

Curiously, the scope support several serial decoding features but these seem to be only available on the analog channels, I fully expected to be able to do stuff like that on the digital channels, this is a bit confusing too...

Actually I think I'm wrong, when I use the "Decode" feature I can select the channel and that list includes the digital channels if the digital analyzer is enabled.
 
Last edited:

nsaspook

Joined Aug 27, 2009
13,086
Just FYI I see no correlation between the color codes on the 16 tiny leads and the colors on the display, all of the digital signals appear to be a dull blue or green or reddish if that's the "active" one, the one we can move around or adjust settings for.
I don't have your scope but the color indicator is on the side of the digital probe trace usually.
1666460739144.png
 

tautech

Joined Oct 8, 2019
383
Just FYI I see no correlation between the color codes on the 16 tiny leads and the colors on the display, all of the digital signals appear to be a dull blue or green or reddish if that's the "active" one, the one we can move around or adjust settings for.
In the MSO (Digital) screen trace colours are only related to H, L or the trigger channel.


The leads are colour coded only back to the breakout header where each lead is also assigned a channel #


You might be well advised to build a little throw away chart to note down connections to channels to help deciphering what you see on the display.
 

Thread Starter

ApacheKid

Joined Jan 12, 2015
1,533
In the MSO (Digital) screen trace colours are only related to H, L or the trigger channel.


The leads are colour coded only back to the breakout header where each lead is also assigned a channel #


You might be well advised to build a little throw away chart to note down connections to channels to help deciphering what you see on the display.
Thanks all of these details help. It might be a good thing to include a future firmware update, some additional flexibility with colors. The blue and green are just a little dull even with brightness set to max don't you think?
 

Thread Starter

ApacheKid

Joined Jan 12, 2015
1,533
This is good stuff, I just played around with SPI using this example from VisualGDB and got some deep insights.

Here I can see the decoded HEX for "Hello, World" as 8bit ASCII.

1666476930885.png

That's the 0x48, 0x65 etc - really cool stuff man.
 
Last edited:

tautech

Joined Oct 8, 2019
383
This is good stuff, I just played around with SPI using this example from VisualGDB and got some deep insights.

Here I can see the decoded HEX for "Hello, World" as 8bit ASCII.

View attachment 279112

That's the 0x48, 0x65 etc - really cool stuff man.
You can change the decode to an ASCII readout, it's on P2 IIRC.
You've correctly set the trigger to CS (your D0) and a falling edge as it's idle high yet the buss seems weird that it's idle low.
 

tautech

Joined Oct 8, 2019
383
@tautech is there any real documentation on the logic SLA1016 operation?
Only that in the 4ch X-E User manual.
https://siglentna.com/download/22002/

There are a few bits additional of info on the NA website in Op tips, Appnotes and in the videos.
This sort of stuff:
https://siglentna.com/operating-tip/adding-mso-capability-sds1004x-e-series-oscilloscopes/
https://siglentna.com/video/adding-...hannels-mso-to-the-sds1004-sds2000x-e-series/

Is there something in particular you need to know ?
 

nsaspook

Joined Aug 27, 2009
13,086
Thanks all of these details help. It might be a good thing to include a future firmware update, some additional flexibility with colors. The blue and green are just a little dull even with brightness set to max don't you think?
I like the neutral colors. Most of the time during serious debugging with the MSO digital channels you are looking for patterns between traces. IMO a busy display of rainbow colors is a distraction.
 

Thread Starter

ApacheKid

Joined Jan 12, 2015
1,533
Here's a good reason that we need better docs:

1666543628606.png

While playing with this I did something and that tabular layout appeared at the top! I have no idea how I got it displayed and no idea what it really means or why it has only three rows or how to scroll that table (which is implied by the scroll bar on the right).
 

Irving

Joined Jan 30, 2016
3,845
Here's a good reason that we need better docs:


While playing with this I did something and that tabular layout appeared at the top! I have no idea how I got it displayed and no idea what it really means or why it has only three rows or how to scroll that table (which is implied by the scroll bar on the right).
Its showing the time from D0 going low (your trigger) to the leading edge of each data item. The details are on page 103 of the user manual, albeit a little brief. However a short while experimenting makes it clear. It wasn't hard to work it out by inspection.
 

Thread Starter

ApacheKid

Joined Jan 12, 2015
1,533
Its showing the time from D0 going low to the leading edge of each data item. The details are on page 103 of the user manual, albeit a little brief. However a short while experimenting makes it clear.
OK, many thanks, its still not clear why that list contains only three rows though.

Scratch that !

The number of rows corresponds to the number of items sent, that are displayed horizontally at the bottom!

1666546893896.png

Seems too, that 7 is the max.
 
Last edited:

tautech

Joined Oct 8, 2019
383
No, but that may be because I don't know something. I was disappointed in the dearth of documentation for the analyzer. I really would have expected a thorough manual, it's not a cheap device.

Thanks.
One presumes those that want an analyzer might know how to drive one however I didn't when I got my first one and being a dealer I couldn't not have some idea so was to some extent forced into the RF world.
Now on my third one, a SVA1032X that is also a single port VNA, it's been a fun ride but I've also ticked off some nice personal projects not possible without instruments of this type.
Are you aware the SA manual has been updated ?
Drill down here to find the User manual for your model:
https://int.siglent.com/download/documents/
 

tautech

Joined Oct 8, 2019
383
Here's a good reason that we need better docs:

View attachment 279163

While playing with this I did something and that tabular layout appeared at the top! I have no idea how I got it displayed and no idea what it really means or why it has only three rows or how to scroll that table (which is implied by the scroll bar on the right).
Well yes and no.
As you know now its the Decode List and you turned it ON from inside the List menu and it's only filling 3 lines as that's all of the bytes on the display. Later you figured this out by slowing the timebase some to get the whole packet on the display.

But you can display more and lots more by slowing the timebase several steps to display multiple packets from the data stream, in fact several hundred, all with a timestamp in relation to the H trigger position. The scroll bar in the List is pushed to the Multifunction control so you can examine all the results in the list.
 

tautech

Joined Oct 8, 2019
383
OK, many thanks, its still not clear why that list contains only three rows though.

Scratch that !

The number of rows corresponds to the number of items sent, that are displayed horizontally at the bottom!

View attachment 279164

Seems too, that 7 is the max.
Yes 7 lines is the max list size but all 10 bytes will be in the Decode list. The position of the scroll bar is the key to pointing that out.
 
Top