Facebook
 Google
 GitHub
 Linkedin
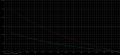
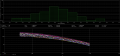
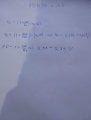
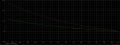
We are going to linearize the graph later on, that's why it doesn't matter beeing linear or not atm.hi,
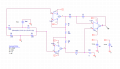
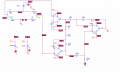
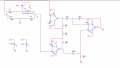
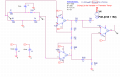
I am currently drawing out your circuit, will post when tested.
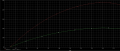
I guess you know that the resistance response of a Thermistor is exp' versus temperature.
There are methods for adding resistors in an attempt linearise the resistance, but these are only much good over short temperature spans.
Some users connect the Vout of a IA into the ADC input of a micro-controller and linearise the readings in the program.
A thermistor would not be my choice for 55C thru 150C, a small device like a LM35 IC, which gives linear Vout would be my choice.
E
NTC Project (Wheatstone Bridge + Instrumentation Amplifier) - Stuck!
- Thread starter jonaas18
- Start date


")