Impedance of inductor against frequency

bertus

Joined Apr 5, 2008
22,887
Hello,

I think you are looking at a non ideal inductor.
The inductor has likely a series resistance.
This resistance you will see at lower frequencies.

Bertus
 

MrChips

Joined Oct 2, 2009
34,630
Hello everyone!

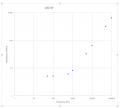
Recently I've been measuring Impedance of inductor against frequency and the results that I found are not clear enough for me.
Can someone tell me why the graph is linear in the beginning, but exponential later on ?

All the best
Look at the graph again.
I see constant up to 500Hz and then linear at higher frequencies.
 

nsaspook

Joined Aug 27, 2009
16,257
Looks like a normal Log scale impedance, frequency graph for about a 1mH inductor with a small series resistance.
 
Last edited:

AnalogKid

Joined Aug 1, 2013
12,055
Okay, but still, why is this so ?
Because it is a real-world inductor, not a theoretical or ideal inductor.

Re-read post #2. ALL inductors have two primary characteristics, the inductance and the resistance. There also is shunt capacitance across the windings, but that usually is not significant at lower frequencies. Your inductor is wound with wire, and that wire has resistance. It looks like your inductor has a resistance (not impedance) of about 6 ohms. You should measure it with an ohmmeter and tell us what you find.

ak
 

Thread Starter

AlwaysNumber1

Joined Dec 4, 2016
52
Because it is a real-world inductor, not a theoretical or ideal inductor.

Re-read post #2. ALL inductors have two primary characteristics, the inductance and the resistance. There also is shunt capacitance across the windings, but that usually is not significant at lower frequencies. Your inductor is wound with wire, and that wire has resistance. It looks like your inductor has a resistance (not impedance) of about 6 ohms. You should measure it with an ohmmeter and tell us what you find.

ak
Okay, sounds more clear for me now
However, you you please explain in more details the influence of resistance and shunt capacitance on this particular graph ?
 

MrChips

Joined Oct 2, 2009
34,630
Your answers were provided in post #2 and #7.

The inductor has resistance of 3-5Ω. This is the dominant parameter at low frequencies.
At frequencies above 500Hz the reactance is 2πfL. That is, the reactance increases linearly with frequency.
 

The Electrician

Joined Oct 9, 2007
2,986
Okay, sounds more clear for me now
However, you you please explain in more details the influence of resistance and shunt capacitance on this particular graph ?
As AnalogKid said, the shunt capacitance won't have a noticeable effect at these low frequencies, so we won't see any effect in the following images.

Here is an image showing the impedance magnitude and AC resistance of a 1 mH inductor (which is what you apparently have) measured with an impedance analyzer. The frequency is swept from 10 Hz to 100 kHz. The green curve is the impedance magnitude and the yellow curve is the AC resistance. There is a marker A at 10 Hz showing the measured values in the upper right corner of the image and another marker B at 1 kHz. The scale is logarithmic for both axes:

Inductor1.jpg

Starting from about 100 Hz the impedance magnitude is rising with frequency. In the vicinity of 10 Hz, the impedance magnitude is nearly constant. This is because the inductor has a DC resistance of about .5 ohm. The reactance of a 1 mH inductor at 10 Hz is .0628 ohms. This is much less than the .5 ohm DC resistance so the impedance magnitude is dominated by the resistance.

At about 1 kHz you'll notice that the AC resistance (yellow) begins to rise. This is mainly because of skin and proximity effect, with a possible contribution of the losses in the ferrite core.

Your inductor has a much larger DC resistance, so to get a result like your inductor, I connected a 5.1 ohm resistor in series with the inductor and measured the combination. These curves should be similar to what your inductor would measure on an analyzer:

Inductor2.jpg
 

The Electrician

Joined Oct 9, 2007
2,986
Here is a sweep of the impedance magnitude and AC resistance extending to 5 MHz. Now you can see the effect of the shunt capacitance. It causes the inductor to exhibit a self resonance at about 832 kHz. Notice how large the AC resistance becomes:

Inductor3.jpg

Also notice that at frequencies above the self resonance the impedance magnitude decreases with increasing frequency rather than increasing with frequency. The inductor is now behaving like a capacitor.
 
Top