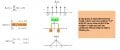
how come rect(t)=1/2 at |t|=1/2

t_n_k

Joined Mar 6, 2009
5,455
The confusion probably arises over the way in which one transcribes the exact definition on the left to the interpretive diagram on the right.

The function rect(t) is strictly defined by the three conditions shown at the left. One then attempts to draw the diagram on the right which represents the definition to the left. How would you draw the diagram given the definition of rect(t)?
 

WBahn

Joined Mar 31, 2012
33,021
The definitions on the left are just that - definitions. Remember that there is no governing board for arbitrary math functions that approves and regulates how a function is defined. There are a number of different definitions for common made-up functions, such as the rectangle function, and most of them are close enough so that the differences seldom matter.

Because the function is discontinuous at |t|=1/2, you can define it to pretty much be whatever you want. This author has chosen to say that, at that exact point, you really are neither in the window or not, so they chose to define it as half-in/half-out. Others define it to be 1 at that point while others define it to be 0. Since we are talking about a continuously defined function, it has to be defined for all values of t. But the specific value it takes on at a single isolated point has essentially no impact on anything. In fact, they could have defined it to be one trillion billion gazillion at those two points and it wouldn't have mattered, just as long as they are defined and they are finite.
 

Thread Starter

PG1995

Joined Apr 15, 2011
832
Thank you for the help, t_n_k, WBahn.

t_n_k said:
The function rect(t) is strictly defined by the three conditions shown at the left. One then attempts to draw the diagram on the right which represents the definition to the left. How would you draw the diagram given the definition of rect(t)?
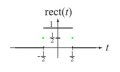
This is how I would draw. I hope you can see where I'm having trouble.

WBahn said:
The definitions on the left are just that - definitions. Remember that there is no governing board for arbitrary math functions that approves and regulates how a function is defined. There are a number of different definitions for common made-up functions, such as the rectangle function, and most of them are close enough so that the differences seldom matter.
Okay. I get your point. So, it's just a matter of definition. Let them define a mule to be a horse, we have no other choice but to agree! :)

WBahn said:
Because the function is discontinuous at |t|=1/2, you can define it to pretty much be whatever you want. This author has chosen to say that, at that exact point, you really are neither in the window or not, so they chose to define it as half-in/half-out.
Perhaps, it has something to do with my limited knowledge of English language or you are trying to say something totally different. What do you mean by the highlighted part?

WBahn said:
Others define it to be 1 at that point while others define it to be 0. Since we are talking about a continuously defined function, it has to be defined for all values of t. But the specific value it takes on at a single isolated point has essentially no impact on anything. In fact, they could have defined it to be one trillion billion gazillion at those two points and it wouldn't have mattered, just as long as they are defined and they are finite.
So, the main purpose is to define it in such a way so that the function becomes a continuous one. Thank you.

Best wishes
PG
 

Attachments

WBahn

Joined Mar 31, 2012
33,021
The rectangle function is also frequently called the window function. If you multiply it by any other function, what you get is a new function that is equal to the old one "within the window" and identically zero outside of it.

The function is intrinsically discontinous and we are not trying to make it continuous. It is, however, continuously defined. By "continuously defined", all we mean is that the function has a defined y-value for any x-value. It does not mean that the function is necessarily continuous, meaning that you can draw the function without ever lifting your pencil. To be continuous, the value at f(x+eps) ==> f(x) as |eps| approaches zero. This simply means that as we get closer and closer to the window edge from either side that the value of the function should get arbitrarily close to the value AT the edge. That will never happen with this definition, now matter how it is defined at the edges of the window, because if we move an infinitesimal amount one way the function is equal to 0 and if we move an infinitesimal amount the other way the function is equal to 1.

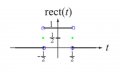
The function as you drew it is closer to the definition given than the one they drew (although I don't know what the yellow highlighting of the edges is supposed to indicate on theirs). But technically the four endpoints on your graph should have open circles indicating that the line does not include the end point.
 

Thread Starter

PG1995

Joined Apr 15, 2011
832
Thanks a lot, WBahn.

The function is intrinsically discontinous and we are not trying to make it continuous. It is, however, continuously defined. By "continuously defined", all we mean is that the function has a defined y-value for any x-value. It does not mean that the function is necessarily continuous, meaning that you can draw the function without ever lifting your pencil. To be continuous, the value at f(x+eps) ==> f(x) as |eps| approaches zero. This simply means that as we get closer and closer to the window edge from either side that the value of the function should get arbitrarily close to the value AT the edge. That will never happen with this definition, now matter how it is defined at the edges of the window, because if we move an infinitesimal amount one way the function is equal to 0 and if we move an infinitesimal amount the other way the function is equal to 1.
Or, a function is continuous at a point if the values of left and right limits are equal to the value of a function at that point and this certainly isn't true in this case.

WBahn said:
The function as you drew it is closer to the definition given than the one they drew (although I don't know what the yellow highlighting of the edges is supposed to indicate on theirs). But technically the four endpoints on your graph should have open circles indicating that the line does not include the end point.
Those yellow highlights were my additions. Actually I was trying to point out that instead of those 'yellow' upright lines, there should be two points as I drew in my diagram. I still wonder why they have upright lines and not individual points!

Regards
PG

PS: I have just noticed that the Wikipedia article also represent the function the same way I was thinking of.
 

Attachments

Last edited:

WBahn

Joined Mar 31, 2012
33,021
I still wonder why they have upright lines and not individual points!
Because they were being a bit sloppy about something that, in almost all circumstances, doesn't matter. They were probably trying to get the notion of a rectangle function across and opted (consciously or not) for simplicity over rigor.

Almost all the time when you see a rectangle function drawn, it will be drawn with vertical sides.
 
Top