Frequency variable inductance in LTSpice

Thread Starter

FuseFuse

Joined Feb 8, 2017
37
Hello,

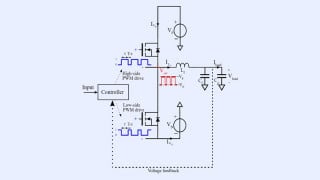
I'm studying a SPICE model for common-mode chokes where windings are represented with frequency dependent voltage sources, as in the picture below
1674479989612.png

K and L parameters are fitted by measurement, while parallel capacitance is a fixed value.

I think it's a good way to simulated how magnetic permeability of a core varies with frequency, but I have some issue in setting the proper schematic to extract impedance curve.
What should I do? I'm used to define an external 1 V source (with 50 ohm series resistance) and a resistive 50 ohm load. Is it correct? I attached the corresponding LTspice file.

Thank you for your help.
 

Attachments

Thread Starter

FuseFuse

Joined Feb 8, 2017
37
hi FF,
This video may help give you a little more information.
E
This is a basical explaination on nominal behaviour of a common-mode choke. There's no modelling for frequency dependent permeability, that is you can only represent inductor with a constant slope impedance at low frequency and you can easily get it with an inductor, that's it.

What I'm looking for is to introduce a dependence of inductance on frequency. By a frequency-dependent source you define a Laplace transform, so you introduce a "frequency-like" variable (s).
In any case, the model I posted must have some issues since I can't extract expected impedance. Any hints?
 

Papabravo

Joined Feb 24, 2006
21,159
I know that permeability can be a function of magnetic induction (flux density) which is a function of current. What materials exhibit frequency dependent permeability?
 

Thread Starter

FuseFuse

Joined Feb 8, 2017
37
I know that permeability can be a function of magnetic induction (flux density) which is a function of current. What materials exhibit frequency dependent permeability?
Permeability is frequency dependent, since it has an almost fixed DC value up to cut-off frequency, where permeability drops and capacitive behavior becomes predominant.
In particular, nanocrystalline cores show a frequency dependent inductance even at low frequencies. Let's have a look at this material for instance

1674548140775.png

Blue and green curves have a variable slope in the inductive region, so frequency-dependent inductances, that come from frequency-dependent permeabilities.
It's a bit tricky to reproduce this behavior in SPICE, since you can define one single inductive value for all the frequency range.
1674548544367.png

The approach I showed before is interesting, as it introduces this L(f) function by using Laplace transforms.
1674548232976.png

But the way this has to be properly used is unknown to me: I attached the .asc file with this schematic shown above. What components have to be connected to 1-4 label nets in order to get the blue or the green curve?
 

Attachments

Papabravo

Joined Feb 24, 2006
21,159
....
What should I do? I'm used to define an external 1 V source (with 50 ohm series resistance) and a resistive 50 ohm load. Is it correct? I attached the corresponding LTspice file.

Thank you for your help.
I think that scheme only works when you know and are matching the impedances of the device under test. In this case you are testing a device that is supposed to attenuate common mode signals and pass differential mode signals. I'm thinking something like a low impedance DC voltage source, for terminals 1 & 2, and current source for the load across 3 & 4. This would look like the primary side of a flyback converter and measure the attenuation of the common mode current noise getting back to the DC source.

I'm not at all sure how you could use a VNA to get what you want IRL or in simulation.
 

Papabravo

Joined Feb 24, 2006
21,159
The only other thing I can offer is the modeling of the individual inductors as a winding in parallel with a non-linear reluctance as describes in this video.

 
Top