About a simulations with Lt-Spice.

Thread Starter

gaetan8888

Joined Nov 14, 2008
50
Hello

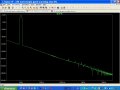
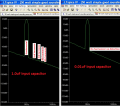
I was doing some esperiments simulations with Lt-Spice.

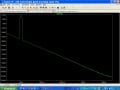
Wen I was reducing the input capacitor to experiment, but wen I do that the distortions raised a lot.

Why ?

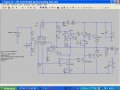
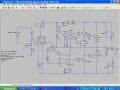
I include the two asc files, one with circuit with 1 uf input capacitor and the second asc file are circuit with .1 uf input capacitor.

Thank

Bye

Gaetan
 

Attachments

Audioguru

Joined Dec 20, 2007
11,248
The value of the input capacitor is calculated for -3dB at a low frequency when calculated with the input impedance of the amplifier. The 1uF capacitor will produce a -3dB frequency that is 10 times lower than the 0.1uF capacitor.
Calculate the amplifier input impedance then use it to calculate the -3dB frequencies produced by each capacitor value.

The value of the input capacitor does not change distortion, instead it changes only the low frequencies response.
 

Thread Starter

gaetan8888

Joined Nov 14, 2008
50
The value of the input capacitor is calculated for -3dB at a low frequency when calculated with the input impedance of the amplifier. The 1uF capacitor will produce a -3dB frequency that is 10 times lower than the 0.1uF capacitor.
Calculate the amplifier input impedance then use it to calculate the -3dB frequencies produced by each capacitor value.

The value of the input capacitor does not change distortion, instead it changes only the low frequencies response.
Hello

I know that it changes only the low frequencies response, that I do want, I need to cut the frequencies under 120 hz, so I've think using .01 uf in the input (as you can see in my asc file). But doing this raised the output distortion of the amp (in simulation).

Thank

Bye

Gaetan
 

crutschow

Joined Mar 14, 2008
38,503
Using the fft in the amp simulations with Lt-Spice, it show the distortions spectrum.
Post a screen clip of the spectrums from both units.
I don't see how changing the simulated cap value (which is an ideal cap) could make much difference in the distortion.
 

Thread Starter

gaetan8888

Joined Nov 14, 2008
50
Post a screen clip of the spectrums from both units.
I don't see how changing the simulated cap value (which is an ideal cap) could make much difference in the distortion.
Hello

Here it is.

Bye

Getan
 

Attachments

Alec_t

Joined Sep 17, 2013
15,117
The vertical scale ranges on the two FFT plots are different, so minor peaks are magnified on one plot relative to the other.
 

Bordodynov

Joined May 20, 2015
3,431
See
.step c2=1e-007
N-Period=5
Fourier components of V(out)
DC component:0.0910835

Harmonic Frequency Fourier Normalized Phase Normalized
Number [Hz] Component Component [degree] Phase [deg]
1 1.000e+03 1.379e+01 1.000e+00 -178.03° 0.00°
2 2.000e+03 2.612e-04 1.895e-05 -86.53° 91.51°
3 3.000e+03 3.577e-05 2.594e-06 -144.08° 33.95°
4 4.000e+03 2.242e-06 1.626e-07 144.98° 323.01°
5 5.000e+03 2.871e-06 2.083e-07 44.89° 222.92°
6 6.000e+03 2.672e-07 1.938e-08 -33.77° 144.26°
7 7.000e+03 3.726e-07 2.703e-08 -128.18° 49.86°
8 8.000e+03 4.354e-08 3.159e-09 162.70° 340.73°
9 9.000e+03 5.400e-08 3.917e-09 62.02° 240.06°
10 1.000e+04 4.578e-09 3.321e-10 -19.84° 158.20°
Total Harmonic Distortion: 0.001913%(0.001925%)


.step c2=1e-006
N-Period=5
Fourier components of V(out)
DC component:0.0910718

Harmonic Frequency Fourier Normalized Phase Normalized
Number [Hz] Component Component [degree] Phase [deg]
1 1.000e+03 1.381e+01 1.000e+00 -179.78° 0.00°
2 2.000e+03 2.594e-04 1.879e-05 -87.78° 92.00°
3 3.000e+03 3.614e-05 2.617e-06 -147.76° 32.03°
4 4.000e+03 2.275e-06 1.648e-07 139.45° 319.24°
5 5.000e+03 2.900e-06 2.100e-07 37.00° 216.79°
6 6.000e+03 2.584e-07 1.872e-08 -45.72° 134.06°
7 7.000e+03 3.857e-07 2.794e-08 -141.34° 38.44°
8 8.000e+03 4.736e-08 3.431e-09 146.12° 325.90°
9 9.000e+03 4.421e-08 3.202e-09 52.48° 232.27°
10 1.000e+04 5.597e-09 4.054e-10 -116.27° 63.51°
Total Harmonic Distortion: 0.001897%(0.001909%)
Analysis of the results of the Fourier analysis shows that the nonlinear distortion is greater when the value of the capacitor is less! This is due to the fact that with an increase in the magnitude of the impedance of a signal source, the magnitude of the total, sequential (at the input) feedback decreases. The influence of the input nonlinear capacity of the input stage also increases. I suspect that the second factor prevails.
It is easy to check by specifying instead of the zero (as in this calculation) impedance of the signal source - 1 kOhm (or the output impedance of the pre-amplifier).
 

Attachments

Top