No. Look carefully at the notation. You are getting the actual value and the magnitude. The vertical bars which are also used for "absolute value" also mean "magnitude" when applied to complex numbers. Fun fact: real numbers on the negative real axis have positive magnitudes. Fun fact #2 is that imaginary numbers have positive real magnitudes.
No. Look carefully at the notation. You are getting the actual value and the magnitude. The vertical bars which are also used for "absolute value" also mean "magnitude" when applied to complex numbers. Fun fact: real numbers on the negative real axis have positive magnitudes. Fun fact #2 is that imaginary numbers have positive real magnitudes.
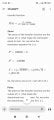
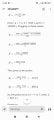
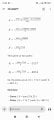
The data is showing you the coordinates of the poles and zeros in the complex plane. Complex numbers consist of a real part and an imaginary part. We often represent them by writing the two parts as the sum of the real part and the imaginary part. The letter j or i is attached to the imaginary part to help distinguish it from the real part. The magnitude of a complex number is computed as:
\( \sqrt{{Re^2}+{Im^2}} \)
The pole zero plot you can make from the values on the Okawa-Denshi start with a set of perpendicular axes. The horizontal axis is the real axis. the vertical axis is the imaginary axis. Using a compass with the point at the origin you draw a circle with a radius of 50 units. Label the intersection of the circle and the positive real axis with the number +50. Label the intersection of the circle with the negative real axis with the number -50. Label the intersections of the circle with the imaginary axis as +j50 and -j50. This circle represents all of the points in the complex plan with a magnitude of 50, which is the corner frequency of your network. The poles form a complex conjugate pair in the left half plane and the zeros are located on the imaginary axis. You know this because they have a real part of 0.
So far nothing here shows any inclination to wander into the right half plane. All realizable second order systems have their roots in the left half plane and are stable. Instabilities arise in higher order system with variable gain which can cause the members of a complex conjugate pair to move into the right half plane. This is evident from a root locus diagram.
ETA: On the Okawa-Denshi site you will get a pole zero plot for a 3rd order filter. I'm guessing they don't do it for the 2nd order filter because the case is trivial and never unstable.
Any mathematics program that allows graphing should work. If you are familiar with Python, you can write a short Python script to make a nice-looking plot of poles and zeros.
Any mathematics program that allows graphing should work. If you are familiar with Python, you can write a short Python script to make a nice-looking plot of poles and zeros.
That's funny, the link seems to be for the commercial version of Matlab. Once upon a time I sprung for the student version, but who wants to pay full price for Matlab? I suppose you could also use Scilab or Maxima since both of those are free.
That's funny, the link seems to be for the commercial version of Matlab. Once upon a time I sprung for the student version, but who wants to pay full price for Matlab? I suppose you could also use Scilab or Maxima since both of those are free.
 Facebook
 Google
 GitHub
 Linkedin