Why I can not see noise and distortion in my FFT diagram in simulink

Thread Starter

mohamis288

Joined Feb 9, 2019
6
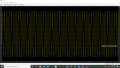
Hello, in 'assignment2' file, in problem 2, we are asked to calculate SFDR in a data converter. it is mainly about a DAC, but I have designed ADC in simulink. not important. anyway, You can see simulink file in 'adc.rar' in the attachment. the image of my simulink diagram is shown below:
adc circuit.png
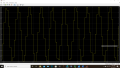
my input signal is a sine wave. then I have used a zero-order-hold followed by quantization. then using a z-transform I have modeled my S/H bandwidth. I do not know why in spectrum analyzer, I can not see any distortion in order to determine SFDR. spectrum analyzer is shown here:

spectrum analyser.png
 

Attachments

Thread Starter

mohamis288

Joined Feb 9, 2019
6
thank you to pay attention to my question @RoofSheep ,
here is the signal after quantizer:

1687371257200.png

my main signal has amplitude of 1 volt at frequency of 2*pi*131*1000/1024 in order to model wanted 0.11Fs input frequency in the question and having coherent sampling.
 

Attachments

Thread Starter

mohamis288

Joined Feb 9, 2019
6
I prefer not to use Simulink's built in FFT and Spectral Analyser. I export the signal I want to analyse to the Matlab Workspace and work from there.
thank you @RoofSheep , I have implemented my diagram like in the following:
Screenshot (726).png

then in MATLAB, using following code:

>> y = abs(fft(yout,1024));
>> plot(y)

FFT plot is exactly the same as before. nothing changed. I do not know why nonlinearity and noise are not considered in my block diagram. at least, I have quantization noise.
 

RoofSheep

Joined Mar 7, 2023
36
thank you @RoofSheep , I have implemented my diagram like in the following:
View attachment 296892

then in MATLAB, using following code:

>> y = abs(fft(yout,1024));
>> plot(y)

FFT plot is exactly the same as before. nothing changed. I do not know why nonlinearity and noise are not considered in my block diagram. at least, I have quantization noise.
Start by plotting your results in dB, i.e. y = 20log10(abs(fft(yout,1024)));
Also look at your sampling rate.
 

Thread Starter

mohamis288

Joined Feb 9, 2019
6
Start by plotting your results in dB, i.e. y = 20log10(abs(fft(yout,1024)));
Also look at your sampling rate.
Thanks @RoofSheep , it seems more natural.
Also, I checked again my sampling frequency. It is 1000 hertz with 1024-point FFT and input frequency equal to 131*fa/1024 which is appropriate in order to avoiding windowing effect and having coherent sampling.
 
Top