What Is The Definition Of "Frequency Domain"?

Thread Starter

Glenn Holland

Joined Dec 26, 2014
703
I'm familiar with the so called "Time Domain" where a function (such as a waveform) is plotted as the amplitude on the vertical axis VS time on the horizontal axis.

A common example of time domain plot is a sine waveform of the displacement of an oscillating system (such as a pendulum) VS time.

However, what is the frequency domain? I've looked it up on line, however the explanations are theoretical and vague. So I'm interested in an explanation in your own words rather than just posting a link.
 

crutschow

Joined Mar 14, 2008
38,909
In the time domain, the variable is time.
In the frequency domain the variable is frequency.
Thus a plot of the amplitude and phase response of an amplifier versus frequency is a frequency domain (Bode) plot.

In instruments an Oscilloscope operates in the time domain and a Spectrum Analyzer operates in the frequency domain.
 

ErnieM

Joined Apr 24, 2011
8,415
Thus, a sine wave as you describe in the frequency domain would have frequency as the horizontal axis and amplitude as the vertical.

A pure sine wave would be just a single point at the horizontal fundamental frequency and vertical amplitude.
 

MrAl

Joined Jun 17, 2014
13,852
I'm familiar with the so called "Time Domain" where a function (such as a waveform) is plotted as the amplitude on the vertical axis VS time on the horizontal axis.

A common example of time domain plot is a sine waveform of the displacement of an oscillating system (such as a pendulum) VS time.

However, what is the frequency domain? I've looked it up on line, however the explanations are theoretical and vague. So I'm interested in an explanation in your own words rather than just posting a link.
Hi,

In addition to the other great replies already here...

The frequency domain is another way to understand and measure signals.
We look at the scope and measure a signal based on its amplitude and time, which could be volts and seconds.

In the frequency domain we measure a signal based on what frequency components it contains. To understand this you have to know what a frequency component is, and that is not that hard to understand.

First, a pure sine wave sin(2*pi*f*t) which you would see on the scope as 1v peak and running across the scope screen horizontally, in the frequency domain that is just represented by the number 1 and with frequency equal to whatever frequency we were looking at, so say it is 1 for now too, so we have sin(2*pi*1*t) as the wave on the scope.
Next, if we look at a pure sine wave that is sin(2*pi*2*t) that is called the 'second harmonic' and that is because that is of frequency two times the first sine wave. Of course if we look at a pure sine wave of sin(2*pi*3*t) that is the 3rd harmonic, and sin(2*pi*4*t) is the fourth harmonic, and sin(2*pi*5*t) is the fifth harmonic, etc. So you can see all we are doing to get these harmonics is increasing the number from 1 to 2, then from 2 to 3, then from 3 to 4, etc., so we get more and more harmonics. In theory, we can increase this number to any value even infinity, but we can deal with regular numbers for now.

Now say we add some of these up in a circuit that adds all the input signals, and say we start with these harmonics:
sin(2*pi*1*t)
sin(2*pi*3*t)
sin(2*pi*5*t)
sin(2*pi*7*t)

and as you can see we are only using the odd harmonics for now.

Next we decrease the amplitude of these by 1/N so we get the pure sine waves:
sin(2*pi*1*t)/1
sin(2*pi*3*t)/3
sin(2*pi*5*t)/5
sin(2*pi*7*t)/7

and note all we did was divide them by their harmonic number which was 1,3, 5, or 7.

Now keep in mind that these are all pure sine waves, just at different frequencies and different amplitudes.

Next we add them all together using a circuit that adds all inputs and we get:
Vout=sin(2*pi*1*t)/1+sin(2*pi*3*t)/3+sin(2*pi*5*t)/5+sin(2*pi*7*t)/7

Now what do you suppose this new wave would look like?
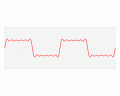
It would look like a square wave (with some ripple impurities because we only used three harmonics).

How did it become a square wave? That's because we used the right harmonics at the right amplitudes in the adder. If we used different harmonics or different amplitudes or both, we would have ended up with a different wave.

Now in the time domain this wave looks like a square wave (with some impurities). In the frequency domain however it looks like four separate sine waves, each with an amplitude and frequency. THAT is the basic representation in the frequency domain, which is a set of amplitudes and frequencies and possibly phase shifts, that make up the same thing we see in the time domain.
Those four waves are the 'components' in the frequency domain.

This sure is interesting because that means we can represent any time domain wave in the frequency domain. Instead of measuring amplitude vs time we measure amplitude vs frequency.

The reason for doing this stems from a very old experiment that a guy did when studying how to solve heat related problems, but it was found that this idea could be used to solve a huge number of problems that were much harder to solve in the time domain. This means you might see problems being worked where the equation is first transformed into the frequency domain, then solved, then transformed back into the time domain. Thus we use this quite a bit in circuit analysis and other fields.

We could look at more examples, but the square wave example is probably the simplest and most widely quoted in various texts.
 
Last edited:

Thread Starter

Glenn Holland

Joined Dec 26, 2014
703
Thus, a sine wave as you describe in the frequency domain would have frequency as the horizontal axis and amplitude as the vertical.

A pure sine wave would be just a single point at the horizontal fundamental frequency and vertical amplitude.
OK - So the horizontal axis would be frequency starting at the origin (zero) to an upper limit and the vertical amplitude would represent the power, voltage, or another scalar quantity.

So would a sine wave of 1 Hz. and an amplitude of 1 volt appear as just a single vertical line 1 volt high that extends above the point of 1 Hz. on the frequency axis?
 

nsaspook

Joined Aug 27, 2009
16,503
It's maybe more useful to provide examples of Time-Frequency Analysis. Lets say you have a signal detector and you want to characterize that signal into structures that can be used to match that signal to other types of signals that are the same or very similar. Imagine a sonar waveform signal of a ship in the time domain on a strip chart. We can easily see the amplitude and some idea of the frequency but it tells us little until we examine closer how the signal is constructed over time and what's energy at what frequency is in each slice of time.

https://en.wikipedia.org/wiki/Acoustic_signature

https://www.mathworks.com/help/sign...alysis.html?requestedDomain=www.mathworks.com
 

MrChips

Joined Oct 2, 2009
35,268
OK - So the horizontal axis would be frequency starting at the origin (zero) to an upper limit and the vertical amplitude would represent the power, voltage, or another scalar quantity.

So would a sine wave of 1 Hz. and an amplitude of 1 volt appear as just a single vertical line 1 volt high that extends above the point of 1 Hz. on the frequency axis?
While in the simplistic view that is correct, you should keep two other facts in the back of your mind. This might come up again later in your travels on the mathematics of signals.

1) Every sine wave would have a relative phase angle. That is, suppose you had two sine waves of different frequencies. Plotting the amplitudes of each as vertical lines is not sufficient to describe the relative phase difference between the two sine waves. There will be another plot of frequency along the horizontal axis and relative phase on the vertical axis.

2) There is such a thing as negative frequency. Hard to imagine but it is there nonetheless. Hence the horizontal axis extends to the left into negative frequencies. There will be another vertical line at -1Hz for both amplitude and phase plots.
 

ErnieM

Joined Apr 24, 2011
8,415
OK - So the horizontal axis would be frequency starting at the origin (zero) to an upper limit and the vertical amplitude would represent the power, voltage, or another scalar quantity.

So would a sine wave of 1 Hz. and an amplitude of 1 volt appear as just a single vertical line 1 volt high that extends above the point of 1 Hz. on the frequency axis?
I would agree with that, except to be a pedantic twit it is actually a point at 1v/1Hz. A line there implies all voltages between 0 and 1.

Should you ever get a Hold of a spectrum analyzer you will actually see a hump about 1 Hz as it is using a narrow band pass filter to sweep thru the signal and the bandwidth is not truly zero. (And that is the old school way of doing it, it's probably done with digital signal processing now. Someone will probably come by and correct me with the current state of the art.)
 

MrChips

Joined Oct 2, 2009
35,268
I would agree with that, except to be a pedantic twit it is actually a point at 1v/1Hz. A line there implies all voltages between 0 and 1.

Should you ever get a Hold of a spectrum analyzer you will actually see a hump about 1 Hz as it is using a narrow band pass filter to sweep thru the signal and the bandwidth is not truly zero. (And that is the old school way of doing it, it's probably done with digital signal processing now. Someone will probably come by and correct me with the current state of the art.)
Hah! You've jumped a step.

Analog signals are a continuum. Hence the frequency transform is also a continuum.
By assuming a discrete point in the spectrum you have made the assumption that the analog waveform has been digitized into discrete samples to form a discrete time series. Now we're talking about a discrete frequency transformation.

More related to your point, it is not exactly pedantic. There are different ways of presenting discrete data. Here are four such ways:

1) draw a dot at (xi,yi)
2) draw a histogram by drawing a line from (xi,0) to (xi,yi)
3) connect the dots by drawing a line from (xi-1,yi-1) to (xi,yi)
4) draw differences by drawing a line from (xi,yi-1) to (xi,yi)

That is using cartesian coordinates. You can also use some other transformation such as polar coordinates for whatever purposes including linear-log and log-log plots.

So it really is a matter of choice of data presentation.
 

MrAl

Joined Jun 17, 2014
13,852
Hi,

Yes non repetitive time signals are better represented by a continuous frequency spectrum. That gets a little more complicated through for a first view. It's easier to start with a continuous repetitive time signal such as a square wave and show how it can be represented with discrete frequencies.
 

MrAl

Joined Jun 17, 2014
13,852
OK - So the horizontal axis would be frequency starting at the origin (zero) to an upper limit and the vertical amplitude would represent the power, voltage, or another scalar quantity.

So would a sine wave of 1 Hz. and an amplitude of 1 volt appear as just a single vertical line 1 volt high that extends above the point of 1 Hz. on the frequency axis?
Hi,

Yes, and for the square wave we would see vertical lines above the x axis at 1Hz, 3Hz, 5Hz, 7Hz, etc., all the odd frequencies, and the height of each line would be 1, 1/3, 1/5, 1/7, respectively (all the inverses of each odd frequency).
There is a slight inaccuracy here though which i left out for simplicity. There is a scale factor of about 1.27 that has to be applied to each of these if we intend to get a square wave of height exactly equal to 1 unit. That's because of the way the waves combine.
So the height at 1Hz would be 1.27 approximately, and the height at 3Hz would be 1.27/3, etc.
 

ErnieM

Joined Apr 24, 2011
8,415
I skipped no steps. On axis of frequency vs amplitude a pure sine wave exists as a single point. That point captures both the frequency and the amplitude of a wave.

That is neither digital nor analog. It is simple math.
 

BR-549

Joined Sep 22, 2013
4,928
Most people can understand the time domain. It's watching or recording an amplitude of current or voltage during a time period.

Some amplitudes, such as current and the voltage caused by current, those amplitudes are composed of many different amplitudes.......it's a sum. That sum has components.

If you freeze the time.........then look at the components at that amplitude......you will see that those amplitudes of the components are ALL rates of current.

Different rates of currents cause different rates of voltage.

A frequency domain plot.........is a current/voltage rate plot of the total current/voltage amplitude.
 

MrAl

Joined Jun 17, 2014
13,852
Hi again,

The short answer is that a time domain waveform can be created by adding a bunch of sine waves of the right frequency and phase and amplitude. If you add the right sine waves you get the same waveform as in the time domain, in theory, so it would look just like the time domain wave on the scope.
 
Top