Facebook
 Google
 GitHub
 Linkedin

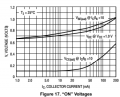
How does that graph show that the Ic/Ib ratio is constant at 10?This graph shows that the Ic/Ib ratio is constant at 10:
View attachment 170574
And shows the rise in Vce when base current is insufficient to saturate the transistor.
Each curve is for a specific value of Ic. Since the horizontal axis is Ib, if the Ic/Ib ratio were constant, each curve would be a vertical line.
The only point where Ic/Ib is 10 is at the right-most end of each curve -- and that's just because that's where they chose to stop plotting the line. They could have continued plotting it and the curves would have continued to go downward.