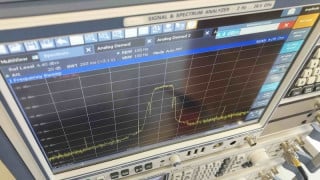
Scope refers to the SDS-2104X+ scope that I am learning to use. One of its analysis features is Bode Plotting using the built-in AWG to provide the input signal and analyzing both the Vout and Vout/Vin and plotting it on the screen.
Vout
Vout/Vin
It took a while to suss using the scope's bode plot analysis all out, but I've finally got the hang of it. While doing that I am comparing the experimental results against the LTS waveform viewer output for comparison and validation.
The only thing that I would like to do better is not have to edit a new trace each time on the waveform viewer for V(out)/V(in). I added node point labels for Vin and Vout but there doesn't seem to be a way to make one for Vout/Vin gain that I know of.
Scope refers to the SDS-2104X+ scope that I am learning to use. One of its analysis features is Bode Plotting using the built-in AWG to provide the input signal and analyzing both the Vout and Vout/Vin and plotting it on the screen.
Vout View attachment 259128
Vout/Vin View attachment 259131
It took a while to suss using the scope's bode plot analysis all out, but I've finally got the hang of it. While doing that I am comparing the experimental results against the LTS waveform viewer output for comparison and validation. View attachment 259129
The only thing that I would like to do better is not have to edit a new trace each time on the waveform viewer for V(out)/V(in). I added node point labels for Vin and Vout but there doesn't seem to be a way to make one for Vout/Vin gain that I know of.
You can rht-click on the waveform viewer pane and select "add plot pane" to add another waveform pane.
Once you have the plot looking the way you want, click anywhere on the waveform pane, then go to "File->Save plot setting".
Then, if you run the simulation again, click the waveform pane, then select "plot setting->reload plot settings" and it will reload the waveform viewer with the saved settings. Unfortunately, their is no way to have it do this automatically, you have to reload each time.
You can also save the current plot under a different name, then load it using "open plot settings file".
You want to make a waveform plot of vout/vin (voltage gain) over frequency?
 Facebook
 Google
 GitHub
 Linkedin