Respiration Values Using Arduino

Thread Starter

carloszoom3000

Joined Oct 14, 2015
20
Hi,

I would like to visualize the respiration levels in the chest and abdominal area.
For that reason i'm using an Arduino and a piezo electric sensor.
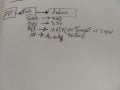
Since the sensor has its own connector, i did some extra wiring(described in the attached picture).
I'm currenly just testing the abdominal area.
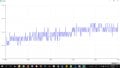
I see that the variations of the signal are not big enough so that you can tell someone is actually breathing.
The idea is to test the patterns, so that eventually new patterns can guide the user for better respiration techniques.

http://bitalino.com/datasheets/PZT_Sensor_Datasheet.pdf

I include the graph that it get when there's no breathing (i wish it could be as flat as possible in that scenario).

I think for testing this signals something that streches should do the trick.
I appreciate your help if there's another one that works better for this purpose.

Regards,
 

Attachments

wayneh

Joined Sep 9, 2010
17,496
How is the piezo connected to the patient? I think you'd need a band around the chest so that expansion causes tension on the band that is detected by the sensor, a bit like a scale.
 

djsfantasi

Joined Apr 11, 2010
9,156
I didn’t see on the data sheet any specification of the sensor output. Like a range of 0 to x mV. If the range is too small, you can use an op amp to amplify the sensor signal to near full scale on the Arduino.

@wayneh , from the data sheet it looks like an elastic band is included.
 

Raymond Genovese

Joined Mar 5, 2016
1,653
First off, you are not measuring respiration with that device, you are measure expansion/contraction of the chest/abdomen area where the band is.

What exactly are you plotting? The raw A2D values? If so, they like the idea of a transfer function as per their data sheet. Your raw resting values (if that is what they are) are not out of line with the lows that they show in some raw data here https://raw.githubusercontent.com/BITalinoWorld/revolution-sample-data/master/PZT/SamplePZT.txt

I think you are going to have to have a subject that is sitting still and then you are not going to get much more than cycles. I could be wrong, but that is what it looks like.
 

Thread Starter

carloszoom3000

Joined Oct 14, 2015
20
How is the piezo connected to the patient? I think you'd need a band around the chest so that expansion causes tension on the band that is detected by the sensor, a bit like a scale.
Hi.
Yes this is a band that goes around the abdominal area as shown in the datasheet.
 

Thread Starter

carloszoom3000

Joined Oct 14, 2015
20
I didn’t see on the data sheet any specification of the sensor output. Like a range of 0 to x mV. If the range is too small, you can use an op amp to amplify the sensor signal to near full scale on the Arduino.

@wayneh , from the data sheet it looks like an elastic band is included.
There´s no operating voltage range specified but the manufacturer says it works similar to this sensor:
http://www.farnell.com/datasheets/2...69.1009025880.1552595334-839277600.1552595334
It looks like it generates signals from (10mV to 100V. Hard to believe it will ever get to 100V).
 

Thread Starter

carloszoom3000

Joined Oct 14, 2015
20
First off, you are not measuring respiration with that device, you are measure expansion/contraction of the chest/abdomen area where the band is.

What exactly are you plotting? The raw A2D values? If so, they like the idea of a transfer function as per their data sheet. Your raw resting values (if that is what they are) are not out of line with the lows that they show in some raw data here https://raw.githubusercontent.com/BITalinoWorld/revolution-sample-data/master/PZT/SamplePZT.txt

I think you are going to have to have a subject that is sitting still and then you are not going to get much more than cycles. I could be wrong, but that is what it looks like.
Yes.
You are right.
The code or the Arduino to read from the analag input is not considering the transfer function described in the datasheet.
I will edit the code and check on the differences.
 

djsfantasi

Joined Apr 11, 2010
9,156
Perhaps you could experimentally determine the range. With the band connected to your helper, measure the signal at varying stages during breathing. You could use an DMM,!oscilloscope, or even the Arduino itself. With the latter, you can capture minimum and maximum outputs. I’d repeat with more than one test subject and with varying breathing styles.

That would give you a range. With that range, a simple signal amplifier could be designed, that would map sensor output to close to full range of the Arduino ADC.

The gain is calculated by the following. Note that full range on an Arduino is 5V, but a simple Op Amp signal amplifier can’t reach 5V (rail voltage) if powered by 5V. Hence, I’ll use 4.7V.
Required Gain = 4.7 / (Smax-Smin)​
This is the gain your Op Amp needs to supply.
 

Thread Starter

carloszoom3000

Joined Oct 14, 2015
20
Hi,
I tried changing the way of getting the data.
Now i have a Mpu6050 which is a Gyroscope and Accelerator.
The idea is to capture the displacement at least in one axis and relate it to a respiratio pattern.
https://components101.com/sensors/mpu6050-module

I connected it to an Arduino UNO and i'm getting the values from the X and Y axis at this moment.

I appreciate your help on the best way to set it up for the purpose of this project.

Regards,
 
Top