Facebook
 Google
 GitHub
 Linkedin
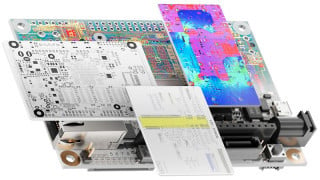
Hello , i want to create the plot of E_i and E_r shown bellow , i should get square blocks ,which comes from constructive and distructive interference of the two modes.
I have written the mathematical expressions and implemented them in matlab (code is attached)
but i get in the plot only one wave pattern, no two wave behavior(constructive and distructive interference squares) .


I have written the mathematical expressions and implemented them in matlab (code is attached)
but i get in the plot only one wave pattern, no two wave behavior(constructive and distructive interference squares) .
Code:
clc
clear all
f=6;
lambda=300/6;
theta_in_rad=0;
theta_out_rad=70/180*pi;
x=linspace(-0.5*lambda,0.5*lambda,1000);
y=linspace(-0.5*lambda,0.5*lambda,1000);
[xx,yy]=meshgrid(x,y);
k=2*pi/lambda;
E_i=1;
E_r=E_i*sqrt(cos(theta_in_rad)/cos(theta_out_rad))
eta=377;
D_x=1.064*lambda;
k_x=k*sin(theta_in_rad)+2*pi/D_x;
k_y=sqrt(k^2-k_x.^2);
%E_t=E_i.*exp(-j*k*xx*sin(theta_in_rad)+j*k*yy*cos(theta_in_rad))+E_r.*exp(-j*k_x*xx-j*k_y*yy);%E_z
E_t=E_i.*exp(-j*k*xx*sin(theta_in_rad)+j*k*yy*cos(theta_in_rad))+E_i.*exp(-j*k_x*xx-j*k_y*yy);%E_z

figure;
imagesc(x/lambda,y/lambda,abs(E_t))
xlabel('x [\lambda]')
ylabel('y [\lambda]')
colorbar;