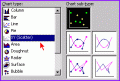
Is it possible? I've had a mess around with some of the chart functions, can't get nowhere near a hysteresis loop though. If not does anyone know of any free software that would do the job?
Toss Excel out and get python with matplotlib and numpy. Also take a look at scipy. These are good tools and you should be able to make a hysteresis curve pretty easily.
If/when you really want to get some raw horsepower, teach yourself PostScript.
Toss Excel out and get python with matplotlib and numpy. Also take a look at scipy. These are good tools and you should be able to make a hysteresis curve pretty easily.
If/when you really want to get some raw horsepower, teach yourself PostScript.

 Facebook
 Google
 GitHub
 Linkedin