Facebook
 Google
 GitHub
 Linkedin
I am having trouble with this task in MATLAB and cant seem to get my graphs right. The following is what I need to do.
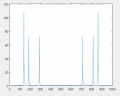
1. Generate a signal with frequencies 100Hz, 200Hz and 350Hz, using sample freq of 1kHz generate 1s of data.
2. Plot the signal and its Discrete Fourier Transform
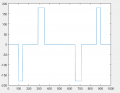
3. Find the frequency response of an LTI system that filters out the higher and lower frequencies using Fourier Transform.
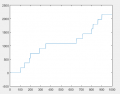
4. Produce magnitude and phase plot of frequency response
5. Plot impulse response of the system
I believe I have done 1-3 correctly but I don't think the graphs for 4 and 5 are correct. Any advice on where I am going wrong would be great, I have only been doing MATLAB for a few weeks.
1. Generate a signal with frequencies 100Hz, 200Hz and 350Hz, using sample freq of 1kHz generate 1s of data.
2. Plot the signal and its Discrete Fourier Transform
3. Find the frequency response of an LTI system that filters out the higher and lower frequencies using Fourier Transform.
4. Produce magnitude and phase plot of frequency response
5. Plot impulse response of the system
I believe I have done 1-3 correctly but I don't think the graphs for 4 and 5 are correct. Any advice on where I am going wrong would be great, I have only been doing MATLAB for a few weeks.
Last edited: