How to draw the Specific plots and curves in LTSpice?

Thread Starter

Mike2526

Joined Nov 10, 2020
86
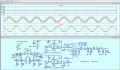
As an aspiring engineer, I have designed an RF Power Amplifier and am now keen on evaluating its performance through various response curves in LTSpice. However, I am unsure of the methodology to check and plot these curves. Specifically, I am interested in the following aspects:

1. Power Supply Voltages vs Drain Voltages Response: How do I measure and plot the relationship between the power supply voltages and the drain voltages of the RF Power Amplifier?
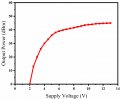
2. Output Power vs Supply Voltages: What steps should I take to determine and plot the output power as a function of the supply voltages?
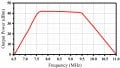
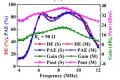
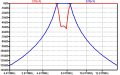
3. Output Power and Power-Added Efficiency (PAE) vs Frequency: How can I measure and plot the output power and PAE at a specific frequency bane (i.e. 7MHz ~ 9MHz)?
4. Return Loss Response: What technique should I use to assess and plot the return loss response of the RF Power Amplifier?
5. Frequency Response of the Matching Network: How do I measure and plot the frequency response of the matching network in the RF Power Amplifier?
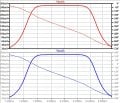
6. Hysteresis Loop for Toroid Transformer: What is the procedure to measure and plot the hysteresis loop for a toroid transformer, specifically comparing the standard leakage inductance (Ts) versus the reduced leakage inductance (Tt)?

I would greatly appreciate any guidance or assistance in this regard (I can provide the schematic .asc file if required).
 

ericgibbs

Joined Jan 29, 2010
21,419
Hi Mike,
If you posted LTSpice asc file examples of those topics, it would simplify effort in replying with solutions to the questions.

We could respond with edited and commented asc files, rather than lengthy text posts.:)

E
 

Thread Starter

Mike2526

Joined Nov 10, 2020
86
Hi Mike,
If you posted LTSpice asc file examples of those topics, it would simplify effort in replying with solutions to the questions.

We could respond with edited and commented asc files, rather than lengthy text posts.:)

E

Thank you so much sir for your kind and prompt reply. Attached please find the asc file as required. If you draw these graphs, I shall be highly grateful to you.
 

Attachments

Thread Starter

Mike2526

Joined Nov 10, 2020
86
Hi Mike,
As you are a student, is this a college or homework project/assignment.

E
No no, Sir, it's not an assignment or task. I am just learning and enhancing my knowledge in this domain. It's quite interesting and fruitful for my future endeavors. Thanks again for your kindness.
 

ericgibbs

Joined Jan 29, 2010
21,419
1. Power Supply Voltages vs Drain Voltages Response: How do I measure and plot the relationship between the power supply voltages and the drain voltages of the RF Power Amplifier?
Hi M,
Is this what you are asking to plot?
E
ScreenHunter 53.gif
 

Alec_t

Joined Sep 17, 2013
15,112
If you want to analyse how circuit parameters change with supply voltages you will need to vary the supply voltages in the sim. One way would be to use non-fixed voltage sources, e.g. PWL type. Or you could use the STEP directive to vary supply voltage.
 

sparky 1

Joined Nov 3, 2018
1,218
Find the needle in the hay stack.
Those with more advanced simulation skills do share Ltspice examples like what you are describing.
I recall not long ago some shared an ltspice example showing how to plot thermal properties.

The examples can be very specific, as a result organizing each specific example falls into the limitations
that a forum is capable of searching and finding.

The thread title "How to draw the specific plots and curves in LTSpice?"
is ok, but it does not solve the problem on how we can search and find the specific simulation that we are looking for.
The forum software can be improved were good ltspice Examples are not cast into the black hole.
The problem is not easy to solve or they would have fixed it.

Most of the time google search will work if you work it forever. How much time does it take to find the correct semiconductor?
What would happen if google search was focused on electronic circuits ?
What would happen if a simulation could be exchanged between simulation software ?
 
Last edited:

Thread Starter

Mike2526

Joined Nov 10, 2020
86
Hi Mike,
Is this simulation type result you are asking for?
E


Added short plot time period image

View attachment 333296
Thank you so much for your kind reply. Actually, i am talking about the graph which are very similar with the attached examples. i Think we can also draw the same graphs by using LTSpice, but i am unable to draw such kind of graphs by using LTSpice. Anxiously waiting for your kind and prompt response, pls.
 

Attachments

Bordodynov

Joined May 20, 2015
3,430
Hi Mike,
The result was very bad. I don't like your transformer. A step-down transformer is usually made. I have done the calculation of the output power. Study the operation of the Meas directive. You want a lot at once, with a minimum of effort. I only had enough for one example. There is a packed folder on my web page Example.zip . It has a folder with examples of using the Meas[ure] directive. Learn.Pow.png
 

Attachments

Bordodynov

Joined May 20, 2015
3,430
I have elements in my library for building a transformer. You specify the number of turns in the winding, the geometric dimensions of the ring (core cross-section, the length of the average magnetic line and the effective magnetic permeability of the core).
 

Thread Starter

Mike2526

Joined Nov 10, 2020
86
Hi Mike,
The result was very bad. I don't like your transformer. A step-down transformer is usually made. I have done the calculation of the output power. Study the operation of the Meas directive. You want a lot at once, with a minimum of effort. I only had enough for one example. There is a packed folder on my web page Example.zip . It has a folder with examples of using the Meas[ure] directive. Learn.View attachment 333346
Sir, thank you so much for your kind help, I am working on it and learning the methodology how to use the mean directives. Here, I just would like to ask how can I draw the Pout graph in the simulation. After running the simulation i can get different types of graphs, but didn't find the "Pout" graph in "add traces to the graph". The rest all drawn properly. Thanks again or your kind help.
 

Thread Starter

Mike2526

Joined Nov 10, 2020
86
I have elements in my library for building a transformer. You specify the number of turns in the winding, the geometric dimensions of the ring (core cross-section, the length of the average magnetic line and the effective magnetic permeability of the core).
Got it Sir, May I inquire that if I will use RC network for coupling in place of Transformer coupling. because I think losses are more by using transformer coupling (Practically). Heat produces, due to Inductors more variation in the output signal. so, I need your valuable recommendation which one is more stable and reliable?
 

Bordodynov

Joined May 20, 2015
3,430
I have elements in my library for building a transformer. You specify the number of turns in the winding, the geometric dimensions of the ring (core cross-section, the length of the average magnetic line and the effective magnetic permeability of the core).
FT-23-43Lin.png
 

Thread Starter

Mike2526

Joined Nov 10, 2020
86
I have elements in my library for building a transformer. You specify the number of turns in the winding, the geometric dimensions of the ring (core cross-section, the length of the average magnetic line and the effective magnetic permeability of the core).
View attachment 333356
Thank you so much sir, but I would like to ask one question, how can I determine the number of turns, cross section area (if current is 6A and voltages are about 20Vpp), length of wire and permeability of the core. While i know the voltage, current and frequency.
 
Top