Facebook
 Google
 GitHub
 Linkedin

Hello! I'm having trouble plotting a graph on the Cadence calculator. I've already entered the values in parametric mode, but I can't seem to generate the graph correctly. Could someone guide me or point me to a resource or tutorial that explains how to do this? regarding the first image.
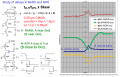
The second image refers to the simulation I already ran.
Include the tpDH and tpLH waveforms (showing maximum and minimum values; ensure graph labels are legible) to demonstrate how the timings were obtained. Indicate how the required timings were measured (use small time steps—e.g., 5 ps—for the simulation). Plot the measured time versus skew (with tpDH and tpLH values on the vertical axis and tskew on the horizontal axis).
The second image illustrates an example I am working on. I ran a parametric analysis ranging from -200 ps to +200 ps.
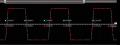
The third image shows the calculator, where I am unable to create the graph as shown in the first image.
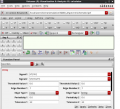
The second image refers to the simulation I already ran.
Include the tpDH and tpLH waveforms (showing maximum and minimum values; ensure graph labels are legible) to demonstrate how the timings were obtained. Indicate how the required timings were measured (use small time steps—e.g., 5 ps—for the simulation). Plot the measured time versus skew (with tpDH and tpLH values on the vertical axis and tskew on the horizontal axis).
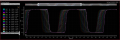
The second image illustrates an example I am working on. I ran a parametric analysis ranging from -200 ps to +200 ps.
The third image shows the calculator, where I am unable to create the graph as shown in the first image.
Attachments
-
 1.3 MB Views: 0