Filter windowing

Thread Starter

Saviour Muscat

Joined Sep 19, 2014
187
Dear members,

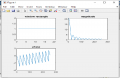
Currently I am doing DSP assignment, I encountered some difficulties, please I need your kind guidance to work out some of the questions. The question is about windowing filter.
Consider a rectangular window of length 21 with non-zero samples in the range 0 ≤ ≤ 20 denoted by []. Using MATLAB plot []. Perform a DFT of length 512 on this rectangular window to find its frequency spectrum denoted by []. Print out the plots of the magnitude and phase of [] for half the range of k.

I am thinking should I use sinc function on the matlab to generate the window?

Thankyou
 

Thread Starter

Saviour Muscat

Joined Sep 19, 2014
187
Hello, I did some research on the internet concluded the below code. Could someone comment on this code, please? I appreciate.

subplot(2,2,1);
v=rectwin(21);
plot(v);
title('window rectangle');
subplot(2,2,2);
magnitude=abs(fft(v,512));
d=magnitude(1:256);
plot(d)
title('magnitude');
subplot(2,2,3);
f=phase(fft(v,512));
k=f(1:256);
plot(k);
title('phase');
 

Attachments

bogosort

Joined Sep 24, 2011
696
Hello, I did some research on the internet concluded the below code. Could someone comment on this code, please? I appreciate.

subplot(2,2,1);
v=rectwin(21);
plot(v);
title('window rectangle');
subplot(2,2,2);
magnitude=abs(fft(v,512));
d=magnitude(1:256);
plot(d)
title('magnitude');
subplot(2,2,3);
f=phase(fft(v,512));
k=f(1:256);
plot(k);
title('phase');
What are you not understanding? Are you confused by the MATLAB code or the DSP part? Try to be specific about your problem.
 

Thread Starter

Saviour Muscat

Joined Sep 19, 2014
187
Thank you for your reply, I did tentative answer and I want someone to underline the mistakes that I did. Both matlab and dsp.

Thank you
Saviour Muscat
 

bogosort

Joined Sep 24, 2011
696
Thank you for your reply, I did tentative answer and I want someone to underline the mistakes that I did. Both matlab and dsp.
The MATLAB part is straightforward. If you're completely new to the language, I'd suggest following a few of the thousands of freely available tutorials. MATLAB has its origins in linear algebra (the MAT stands for matrix), and it's useful to keep in mind that it treats arrays of values as vectors. So, for example, the line "v = rectwin(21)" creates a vector named 'v' whose components are all the value 1. Why 1? Because that's the definition of a rectangular window, and that's what the 'rectwin' function outputs. The 21 in the argument to 'rectwin' tells MATLAB the size of the output vector. Therefore, 'v' has 21 elements, each of which is a 1.

If you don't understand what a MATLAB function does, you can run "help <function name>" -- e.g., "help rectwin" -- to get a brief help document. Usually these come with examples, which you should try out. Note that if a statement ends with a semicolon (';'), then MATLAB will suppress its output. If you want to see the output of a particular command, don't put a semicolon at the end.

What about the line "magnitude=abs(fft(v,512))"? This is a composition of functions -- like f(g(x)) in math -- so we read it from the inside out. First, "fft(v, 512)" outputs a 512-point DFT of the input vector 'v'. Why 512? For technical reasons, most FFT algorithms work fastest when they're a power of 2, and 512 = 2^9. Next, the complex-valued DFT output becomes the argument of the "abs()" function, which returns the absolute value (magnitude) of each point in the DFT. In DSP terms, taking the magnitude means that we're ignoring the phase (at least for now). Thus, the vector named 'magnitude' is a 512-component vector of real numbers. This vector represents the frequency spectrum of the original vector 'v'. Finally, the line "d=magnitude(1:256)" tells MATLAB to take the first 256 components of the 'magnitude' vector and assign them to the 'd' vector. So, 'd' is a 256-component vector of real numbers that represents the first half of the spectrum of 'v'. The rest of the code proceeds similarly for phase.

Much more important than understanding the code, however, is understanding the DSP. Do you know what a DFT is? Do you understand why, for real-valued inputs, we only need half the spectrum? You're correct that the spectrum of a rectangular window in time is a sinc function in frequency; can you explain why? In the plot labeled "magnitude", we only see half of a rectified sinc function; given the operations performed in the time domain, does this make sense?

I'd recommend studying your DSP book + external resources until you can answer these types of questions confidently.
 

Thread Starter

Saviour Muscat

Joined Sep 19, 2014
187
Thank you very much for your reply.
Please just for now can you correct my work?please.
I am out of time
thankyou for understanding
 
Last edited:

Thread Starter

Saviour Muscat

Joined Sep 19, 2014
187
Bertus thank you for the material given, I am going through them later on( already downloaded all the material), kindly can you guide me accordingly to underline the mistakes, please, the reason is I am out of time now.
 
Top