Facebook
 Google
 GitHub
 Linkedin
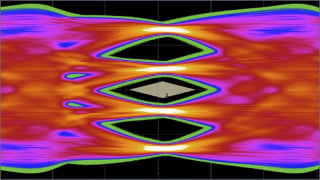
The following are daily power output charts of a solar PV inverter, which of charts shows a faulted (erroneous) data signature in your opinion?
a. 1
b. 2
c. 3
d. 4
e. All are valid signatures

Hey guys, im trying to solve this problem. I'm a student and new to this topic.
I think that 1 might be the faulty one, because killowatt cant be below zero? but i'm not sure.
I'd appreciate your guidance/help. Thanks in advance!
a. 1
b. 2
c. 3
d. 4
e. All are valid signatures
Hey guys, im trying to solve this problem. I'm a student and new to this topic.
I think that 1 might be the faulty one, because killowatt cant be below zero? but i'm not sure.
I'd appreciate your guidance/help. Thanks in advance!