Facebook
 Google
 GitHub
 Linkedin
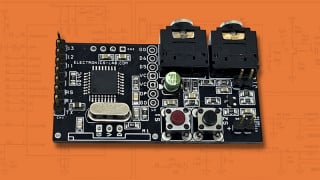
Pretty good and has two sockets if you want to get close to a matched pair.You can buy a semiconductor curve tracer, assembled or in kit form.
Or you can build your own.
You can also build a computerized curve tracer with a couple of DACs and an ADC.
A curve tracer is very handy for checking transistors, diodes, zener diodes, tunnel diodes, etc.
View attachment 218622
View attachment 218623
Ron
") Remember getting valves (tubes) and transistors as "matched pairs"?
Remember getting valves (tubes) and transistors as "matched pairs"?