Facebook
 Google
 GitHub
 Linkedin
Bill,
It's really a matched precision amp for really low frequency stuff, like instrumentation amplifiers.
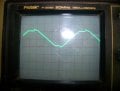
I just got done testing the real thing in operation. I adjusted the spice simulation to what my real-world measurements were, using my laboratory-quality ultraprecise gee-whiz $2.99-on-sale Harbor Freight meter but the results on my Hitachi 'scope were so close to the LTSpice model, it's hardly worth taking photos.
Caps were measured at 99nF each. I didn't bother changing them for the 1% difference.
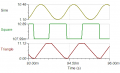
716.3 Hz LTSpice-predicted frequency
684.9 Hz Measured frequency (my 'scope is not calibrated)
Still, that's well within 5% of what the simulation said.Waveforms were nearly identical, except there was a slight clipping of the bottom of the sinewave. I'm blaming that on the 0.31v difference in the absolute values of the rails.
And no, I didn't put 0.1uF caps across the power pins like I should've (bad Wook! Bad, bad...) but they weren't in the proposed schematic, either. So there.
It's really a matched precision amp for really low frequency stuff, like instrumentation amplifiers.
I just got done testing the real thing in operation. I adjusted the spice simulation to what my real-world measurements were, using my laboratory-quality ultraprecise gee-whiz $2.99-on-sale Harbor Freight meter
but the results on my Hitachi 'scope were so close to the LTSpice model, it's hardly worth taking photos.Caps were measured at 99nF each. I didn't bother changing them for the 1% difference.
716.3 Hz LTSpice-predicted frequency
684.9 Hz Measured frequency (my 'scope is not calibrated)
Still, that's well within 5% of what the simulation said.Waveforms were nearly identical, except there was a slight clipping of the bottom of the sinewave. I'm blaming that on the 0.31v difference in the absolute values of the rails.
And no, I didn't put 0.1uF caps across the power pins like I should've (bad Wook! Bad, bad...) but they weren't in the proposed schematic, either. So there.
Attachments
-
 80.4 KB Views: 42