Brain computer Interface (EEG)

Thread Starter

hanukaran

Joined Mar 29, 2012
21
hi sir,

% All frequency values are in Hz.
Fs = 266.3739837; % Sampling Frequency
Fstop1 = 7; % First Stopband Frequency
Fpass1 = 8; % First Passband Frequency
Fpass2 = 65; % Second Passband Frequency
Fstop2 = 67; % Second Stopband Frequency
Astop1 = 60; % First Stopband Attenuation (dB)
Apass = 1; % Passband Ripple (dB)
Astop2 = 80; % Second Stopband Attenuation (dB)
match = 'stopband'; % Band to match exactly
% Construct an FDESIGN object and call its BUTTER method.
h = fdesign.bandpass(Fstop1, Fpass1, Fpass2, Fstop2, Astop1, Apass, ...
Astop2, Fs);
Hd = design(h, 'butter', 'MatchExactly', match);
EEG2=filter(Hd,EEG);
figure (1)
plot (EEG2)


Just want to ask..is that this script can be use to noise cancelattion...and what you mean by "subset of what FFT gives you"

thanks
 

panic mode

Joined Oct 10, 2011
5,196
FFT gives you set of numbers.
they represent frequency and magnitude of bunch of sinusoids (set).
you need to pick ones you want to keep (subset), then set zero magnitude for all others and run inverse FFT. if you made right pick (and your data is good), you will get clean and noise free signal.
 

Thread Starter

hanukaran

Joined Mar 29, 2012
21
I know that im questioning alot...hehe...."you need to pick ones you want to keep (subset),"how sure that which one is need to keep or not...:(
 

panic mode

Joined Oct 10, 2011
5,196
i don't know anything about brain waves but bartus posted some links that could be useful.
it is not like you are inventing this from scratch, there are existing EEG devices, look at their signals. if you can get sample of the data from working unit, run it through FFT and you will see what components are present. then in your design, use the same ones to filter your data.
good luck...
 

Thread Starter

hanukaran

Joined Mar 29, 2012
21
subplot(221);stem(LD);title('LD Low-pass analysis filter');grid;
subplot(222);stem(HD);title('HD Low-pass reconstruction filter');grid;
subplot(223);stem(LR);title('LR High-pass analysis filter');grid;
subplot(224);stem(HR);title('HR High-pass reconstruction filter÷');grid;
[C,L]=wavedec(s,7,'db4'); % Using wavelet db4 multi-scale decomposition of the signal (Layer 7)
C7=appcoef(C,L,'db4',7);%-Scale 128
D7=detcoef(C,L,7);% Detail coefficients
D6=detcoef(C,L,6);% Scale 64
D5=detcoef(C,L,5);% Scale 32
D4=detcoef(C,L,4);% Scale 16
D3=detcoef(C,L,3);% Scale 8
D2=detcoef(C,L,2);% Scale 4
D1=detcoef(C,L,1);% Scale 2
figure(3);
subplot(711);plot(D7);Ylabel('D7');title('Detail coefficients');
subplot(712);plot(D6);Ylabel('D6');
subplot(713);plot(D5);Ylabel('D5');
subplot(714);plot(D4);Ylabel('D4');
subplot(715);plot(D3);Ylabel('D3');
subplot(716);plot(D2);Ylabel('D2');
subplot(717);plot(D1);Ylabel('D1');
[C,L]=wavedec(s,6,'db4');% Approximation coefficient of scale 64
C6=appcoef(C,L,'db4',6);
[C,L]=wavedec(s,5,'db4');% Scale 32
C5=appcoef(C,L,'db4',5);
[C,L]=wavedec(s,4,'db4');% Scale 16
C4=appcoef(C,L,'db4',4);
[C,L]=wavedec(s,3,'db4');% Scale 8
C3=appcoef(C,L,'db4',3);
[C,L]=wavedec(s,2,'db4');% Scale 4
C2=appcoef(C,L,'db4',2);
[C,L]=wavedec(s,1,'db4');% Scale 2
C1=appcoef(C,L,'db4',1);
figure(4);
subplot(711);plot(C7);Ylabel('C7');title('Approximate coefficients');
subplot(712);plot(C6);Ylabel('C6');
subplot(713);plot(C5);Ylabel('C5');
subplot(714);plot(C4);Ylabel('C4');
subplot(715);plot(C3);Ylabel('C3');
subplot(716);plot(C2);Ylabel('C2');
subplot(717);plot(C1);Ylabel('C1');
% Bandwidth of 0.5 Hz to 85 Hz; sampling frequency fs = 173.61Hz
%d-wave(1~4Hz);?-wave(4~8Hz);a-wave(8~13Hz);ß-wave(14~30Hz);
%******************************
[C,L]=wavedec(s,7,'db4');% Scale of 128 to 64
C7=appcoef(C,L,'db4',7);
D7=detcoef(C,L,7);
D6=detcoef(C,L,6);% Scale 64
D5=detcoef(C,L,5);% Scale 32
D4=detcoef(C,L,4);% Scale 16
D3=detcoef(C,L,3);% Scale 8
D2=detcoef(C,L,2);% Scale 4
D1=detcoef(C,L,1);% Scale 2
[C,L]=wavedec(s,7,'db4');
SRC7=wrcoef('a',C,L,'db4',7); % Decomposition coefficient reconstruction
SRC6=wrcoef('a',C,L,'db4',6);
SRC5=wrcoef('a',C,L,'db4',5);
SRC4=wrcoef('a',C,L,'db4',4);
SRC3=wrcoef('a',C,L,'db4',3);
SRC2=wrcoef('a',C,L,'db4',2);
SRC1=wrcoef('a',C,L,'db4',1);
SRD7=wrcoef('d',C,L,'db4',7);
SRD6=wrcoef('d',C,L,'db4',6);
SRD5=wrcoef('d',C,L,'db4',5);
SRD4=wrcoef('d',C,L,'db4',4);
SRD3=wrcoef('d',C,L,'db4',3);
SRD2=wrcoef('d',C,L,'db4',2);
SRD1=wrcoef('d',C,L,'db4',1);


i got the code from some link...can you give me a little explanation about this coding..i need to know about coefficent ...Give me some explanation and from that i hope i can do my own research..thanks:)
 

panic mode

Joined Oct 10, 2011
5,196
no, you can get that from site where the code was posted.

but you can place cursor on any instruction and hit F1 to get help.
and you can also use breakpoints to execute code sample block by block or line by line (you can also use F10 to execute line by line without placing breakpoints).
 

Thread Starter

hanukaran

Joined Mar 29, 2012
21
could you give me brief abut this coding here.....

fs=fft(s,1024);% Fast Fourier Transform
pp=fs.*conj(fs)/1024;% Calculate the power spectrum
ff=(0:511)/1024/dalt;% Of points corresponding to the frequency value
subplot(312);plot(ff,pp(1:512));Ylabel('Power spectral density');Xlabel('Frequency');title('Signal power spectrum');axis([0 55 -10 110000]);

The N=is 4096
fs=173.61

I need to know why 1024 choosen...any one please help m
 

MrChips

Joined Oct 2, 2009
35,090
The FFT algorithm works on array sizes that are powers of 2.
This is because of the basic butterfly computation that operates on pairs of data.
When you specify an array size that is not a power of 2 the procedure will pad the remaining data with zeros.
 

Thread Starter

hanukaran

Joined Mar 29, 2012
21
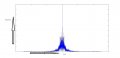
sorry for disturb again...how to create a command to plot frequency versus time....i mean like this image..because I want to calculate the average frequency in each second
 

Attachments

Thread Starter

hanukaran

Joined Mar 29, 2012
21
sir...how to choose 1 second data only ..i mean if i want to plot means i can do like this
plot(t,E:),n));
axis([0 1 -100 100]);
it will plot from 0 until 1 second only...but let say i want to make this 1 second become one data ..example E1 = 0 until 1 second data...This E1 i will use to get the FFT...did you get what i mean?
 

Thread Starter

hanukaran

Joined Mar 29, 2012
21
if i calculate mean of first second(s) of frequency (0-1)...how to calculate the continues seconds like 1-2....2-3....how the command will be like....i use 1second data only to get the mean frequency....
A=f(f>0);
T=mean(A);
now i want to use more than 1 second data...any idea
I need calculate the mean frequency from 1second to 2second...than continue
i can get for total mean for whole data..if want to find mean frequency second by second ..i confuse..any idea
 

panic mode

Joined Oct 10, 2011
5,196
any luck yet?

loop can work but as post 30 suggests, Matlab only works on vectors or arrays of certain size. if needed, matlab automatically pads the vector or array with zeroes to get proper 2^n size. since that size is unlikely to match your sampling frequency (sampling frequency Fs, gives you Fs samples every second) and you don't want FFT to work on entire sample collection, easiest would be to copy data from datastream in 1s chunks (precisely Fs samples) into separate (temporary) array. matlab will pad it with zeroes if needed. so doing FFT on that 1s array is what you should try. you can put everything in a loop, something like

Rich (BB code):
seconds=size(datastream,1)/Fs
for i=1:seconds-1
   ....
end for
 

Thread Starter

hanukaran

Joined Mar 29, 2012
21
Hi sir,
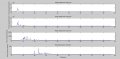
This figure is showing that extract all the brainwaves from raw data...this 1 is using wavelet decomposition method...what i'm seeing is the psd n frequency of each brainwaves...is that we can determine the dominant brainwave of this raw data?
 

Attachments

Top