Facebook
 Google
 GitHub
 Linkedin
Hi,
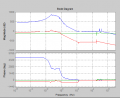
The blue, green, and red plots are a, b, and a+b respectively.
What I'm having a hard time understanding is how a+b is formed. Looking at the magnitude of a, it is in the range of 500 dB or \(10^{25}\). Whereas, looking at b, it is a negative dB gain, so a number of small magnitude. Although I do expect to see the gain of a+b to be lower than that of a, I can't explain why the drop is so significant.
Am I missing something fundamentally important here? or is this fishy to anyone else?
If it makes any difference, I directly got this plots in matlab using
tia
The blue, green, and red plots are a, b, and a+b respectively.
What I'm having a hard time understanding is how a+b is formed. Looking at the magnitude of a, it is in the range of 500 dB or \(10^{25}\). Whereas, looking at b, it is a negative dB gain, so a number of small magnitude. Although I do expect to see the gain of a+b to be lower than that of a, I can't explain why the drop is so significant.
Am I missing something fundamentally important here? or is this fishy to anyone else?
If it makes any difference, I directly got this plots in matlab using
Rich (BB code):
bode(a,b,a+b)Attachments
-
 11.8 KB Views: 15
Last edited: