i'm trying to design a bandpass filter with pass band frequency from 10 kHz to 20 kHz and gain = 1
however, my circuit didnt give me the correct graph.. my circuit is correct?
You need to tell us a little more about your project.
Your circuit appears to be a cascade of a high pass filter followed by a low pass filter.
Usually filters are specified by more than just saying "pass band frequency from 10 kHz to 20 kHz and gain = 1".
Is that all your problem asks for? Or have you heard phrases like "Butterworth filter", "Chebychev filter", "maximally flat), "pass band ripple", etc.
When you say "my circuit didnt give me the correct graph", are you referring to a Bode plot of the filter response? In what way did it fail to give the "correct graph"?
You need to tell us a little more about your project.
Your circuit appears to be a cascade of a high pass filter followed by a low pass filter.
Usually filters are specified by more than just saying "pass band frequency from 10 kHz to 20 kHz and gain = 1".
Is that all your problem asks for? Or have you heard phrases like "Butterworth filter", "Chebychev filter", "maximally flat), "pass band ripple", etc.
When you say "my circuit didnt give me the correct graph", are you referring to a Bode plot of the filter response? In what way did it fail to give the "correct graph"?
ok.. thanks for your reply..
i want to design a bandpass filter with pass band frequency from 10 kHz to 20 kHz and gain = 1 . By combining a Butterworth 2nd order low pass filter and a high pass filter to obtain the bandpass filter. The roll-off rate should be at least -40dB/ decade.
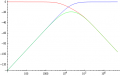
the correct graph should give me -40db/decade for the roll of rate..
but, my graph can't achieved -3dB.. that's why i said, my graph is incorrect..

 Facebook
 Google
 GitHub
 Linkedin