Facebook
 Google
 GitHub
 Linkedin
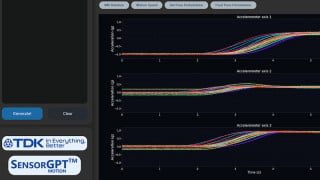
What does this figure represent?
It is in the context of Coaxial cable, but I can't really tell what does it describe, what versus what, and from what formula this plot came from?

It is in the context of Coaxial cable, but I can't really tell what does it describe, what versus what, and from what formula this plot came from?